Of the many betting systems I have encountered in my quest for the “perfect retirement plan” the laying of horses at a shorter price than which you backed it at, is a common and often fatal “get rich quick” scheme many punters regret hearing about. But what if someone has put a lot of time and effort into finding runners that meet certain criteria and don’t actually kick the arse out of finding life changing profit, this might be a low risk opportunity to make your own little niche in the vast minefield that is trading horseracing. The someone I am talking about is a website called “In Running Trading Tool” and they have several schemes detailed on the site where you can use their stats to drill down to specific runners which stand every chance of fulfilling your expectations. To this end I am going to start yet another study into one of the systems listed and post my findings here on Bet-Or-Not so that you can Bet Or Not.
Before I get into the nuts and bolts of the system it may be worth explaining just what a “tick” is in terms of trading trading on the betting exchanges.
The odds on the exchanges (and bookmakers sites) are graduated and displayed as a decimal starting with 1.01 which equates to 1/1000 or “a thousand to one on” meaning bet £1000 to win a quid to 1000.00 which is 1000/1 or “bet a quid to win a thousand”. the graduations between these two extremes are known as ticks. Just to confuse matters further not all ticks are the same. For instance, 10 ticks above the odds of 1.01 are 1.1 (1/100), 10 ticks down from 1000.00 the odds are 950.00. So you can see that the closer you get to a 99.9% probability the closer the ticks are graduated. So if we are looking to lay a horse 15 ticks below the price we backed it at an odds on fav has to do a lot more work in terms of persuading the markets that it is going to win than a 100/1 ouside that perhaps just has to take the lead for a furlong to entice the markets to drop to 70/1 which is 15 ticks below. Its still not going to win but we will have taken our profit long before the finishing line. The all encompassing secret to this is identifying which runners are more likely to impress traders enough to warrant them backing the horse as it runs through the race.
The first thing that springs to mind is a “front runner” this is a horse that takes up the lead in a race and gives the impression that it has something to offer. While this can work sometimes I have just watched Every Breaking Wave lead from start to finish but only “DOBBED” at the last fence as the favourite chased him down. (Dobbing is another strategy where you back a horse at odds and lay it at odds whereby you double your money or lose the lot, hence the term Double Or Bust – another system for another study)
What the poeple at “In Running Trading” have done is narrow such runners down to starting prices, win percentages, and if the horse has been profitable in the past. With this work already done I can now settle down with this criteria and produce to you some profit and loss figures. On first look at this in a mid week race cards it seem that there are only going to be between 2 and 4 selections each day.
The criteria outlined on the website for this particular study are as follows
1. Settings as Default
2. Open the ShortInRunning tab
3. Sort by win% column, highest at the top.
4a. Selections must have at least a 15% win strike rate
4b. They must also have a positive figure in black in the ShortInRun column, directly to the left of the Green% column.
5. Max BSP is less than 21 and Min BSP is greater than 2.5
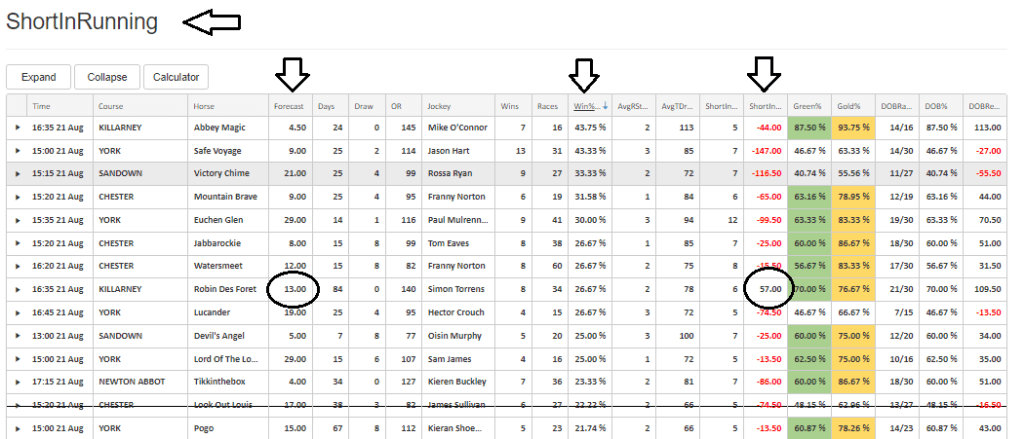
The screenshot above shows how you should have the “short in Running” Tab set up and you can see that there is one selection showing in the shot, Robin Des Foret running at Killarney at 16:35. The forecast odds are 13.00 which is well within the parameters. Its win strike rate is 26.67% and it has a short in run return of £57.00
In actual fact there are 4 selections for today and with this website you can export specific selections into an excel spreadsheet which contains the whole history of each horse including previous race prices and in play lows as well as the tick drop count for each race and a host of other information too vast to list in this post
To this end I have exported todays selections and provided the spreadsheet for you to download
Check back later or do your own study to see how these runners faired and what profit is possible
To get your own 7 day trial of the in running trading tool click here
