Betfair Historical Data has been, for some time now, openly available for free but it seems that no one is prepared to share just how you open the damned stuff!!!
There are plenty of sites out there willing to share their python knowledge but stop short of a full explanation – very frustrating.
At this point I have to give credit to “Trading The Market” guys who have finally given me the Eureka Moment!
If you follow the steps below you will soon have all the research information to back test your systems.
To begin with you do need to have a betfair account and to access which data you need you will need to be logged in and at the following page
https://historicdata.betfair.com/#/home
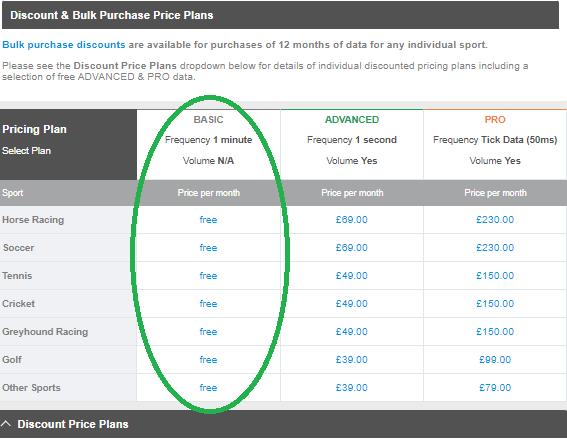
For the purposes of this post I will be using the basic plan which costs nothing and has a data frequency of 1 minute. If you need more frequent data logs then you will have to purchase your data by the month but there are free plans available for limited months mainly in 2020.
In this post I will be analysing the data from the North London Derby – Arsenal v Tottenham on the 1st October 2022
The easy way to handle this data is to “purchase” a month at a time so I will “Buy” the Soccer data from OCT 2022
To do this simply select the plan, sport, and month you need in the drop down boxes and click “Add to Purchases” and then the “purchase” as in the screen shot below

You will then be asked to confirm your purchase – Check that you haven’t included the wrong plan by mistake as the fee will be taken straight from your betfair balance. If everything is ok click confirm and you will see the following screen.

As you can see from the screen shot there are over 250000 markets! for our research we only need 3 or 4 of these so we need to find them.
I want to know how the under/over Markets behaved when each goal went in during the match. To do this click on the “My Data” Tab as shown below and you will see your most recent purchases as well as plans you have bought before.

We now need to populate the down load fields with the information that we need so if we look at the match stats we can see that there were 4 goals scored in total.

I want to see the following market odds
O/U 1.5
O/U 2.5
O/U 3.5
O/U 4.5
O/U 5.5
O/U 6.5
and the Match.
To do this we need to populate the download files panel as follows:

In the Plan Box (which is at the top but hidden in this screen shot) enter Basic
In the Sport Box enter Soccer
In the From and Upto Boxes enter 1 Oct 2022
Leave the event ID Blank
In the Event Name box enter Arsenal
In the Market Type box select the markets you need and in this case its Match_Odds
Over_Under_25
Over_Under_35
Over_Under_45
Over_Under_55
Over_Under_65
In the Country Box select GB (There is no UK)
and in the File Type Box select M
Click the Add to Downloads button
You now should have 12 files ready to down load.
Click the Yellow Download button

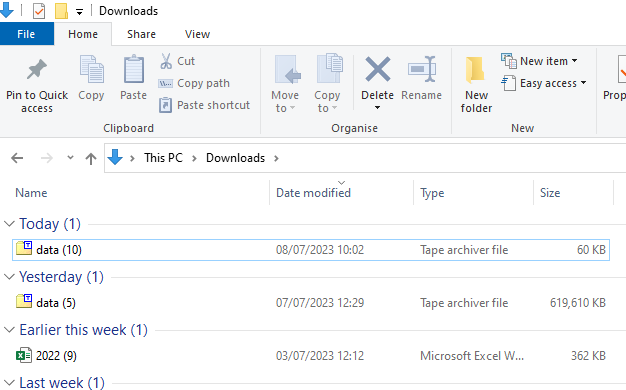
You will find this file in your downloads folder as a Data “tar” file
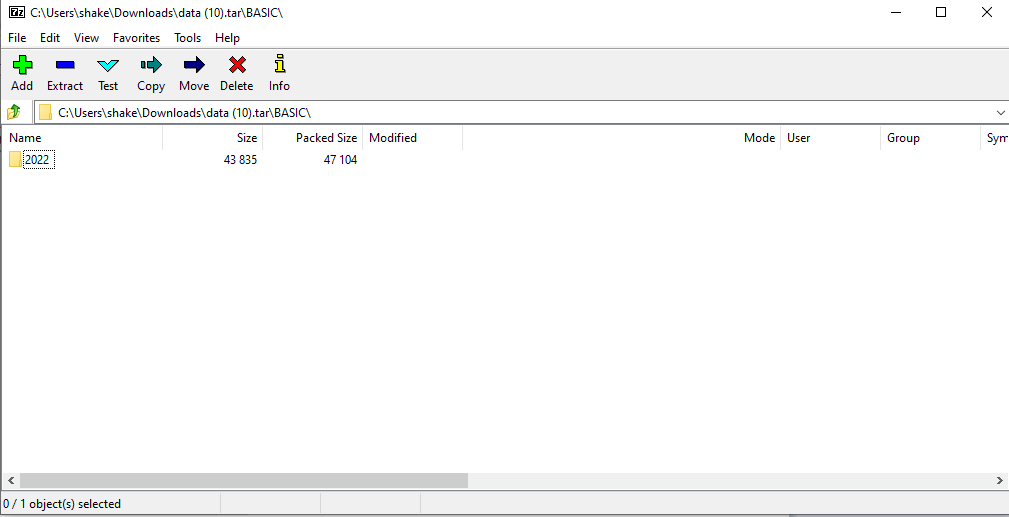
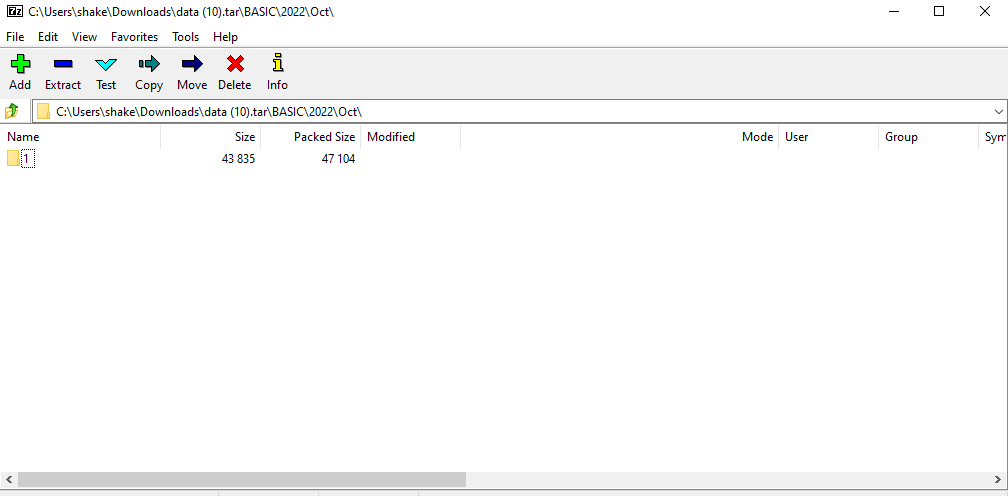
Double click the file to un pack it in your unzipping program

Keep double clicking until you get to the actual data files


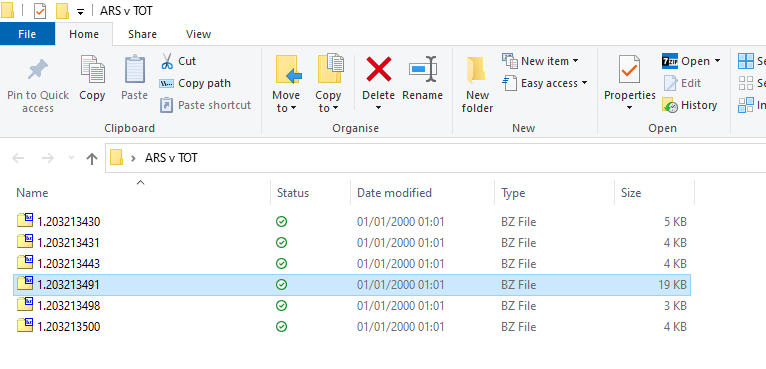
You should now see your 6 “bz2” files
To make them easy to find Create a new folder on your desktop and name it ARS v TOT

You can now drag and drop the files into this folder from your unpacking software

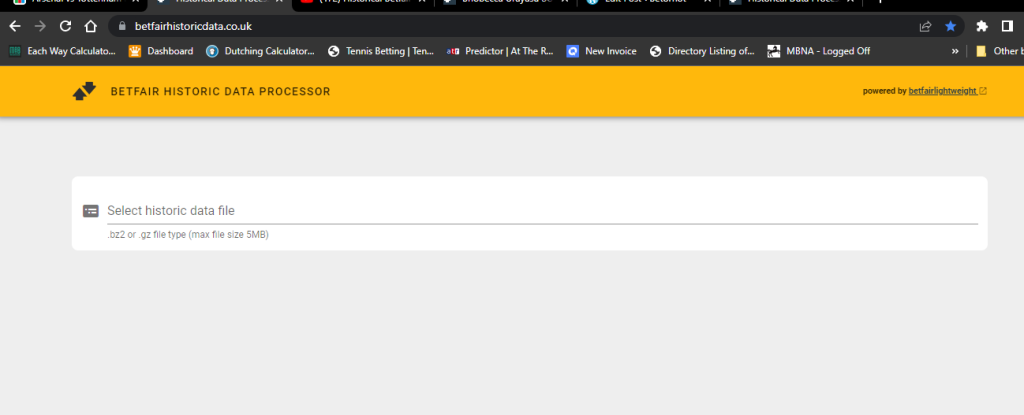
We now need to convert these files into a readable format and Betfair provide one such program easily available from their website.
You will find this here
https://www.betfairhistoricdata.co.uk/
The first file we want to see is the Match Odds and this will usually be the largest file as most volume would have passed through that market. In this case we are looking at File 1.203213491
These are not very user friendly file names so I am going to rename them. to do this we simply select a file from the list using the betfair Historical Data Processor as below and note the file number and which market it contains. In this case File 1.203213498 is the O/U 6.5 goals Market. We dont want to do anything else yet. We are just identifying the files for our convenience
We can then repeat the process with all the files noting the file numbers to the markets and then rename all the files as below

We are now going to convert these files into meaningful excel ranges where we can look at them in more detail. To do this we again select a file from the folder using the Historical Data Processor and click the download settings button as shown in the screenshot below

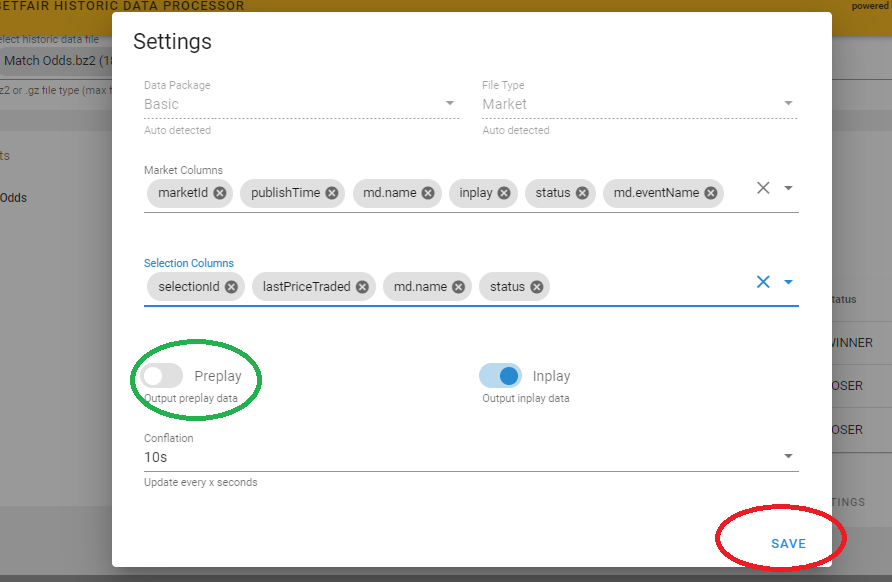
This will open the settings dialog box as shown below
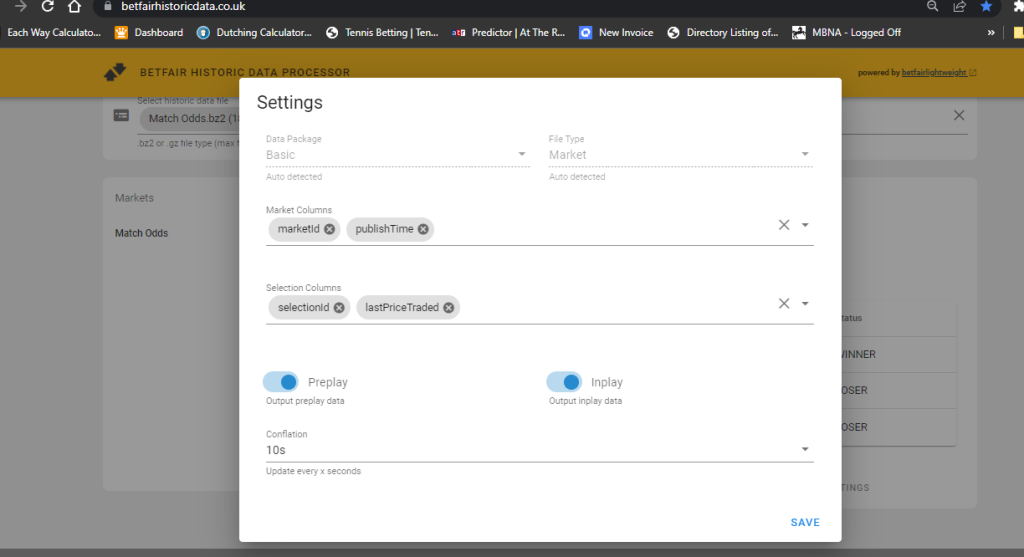
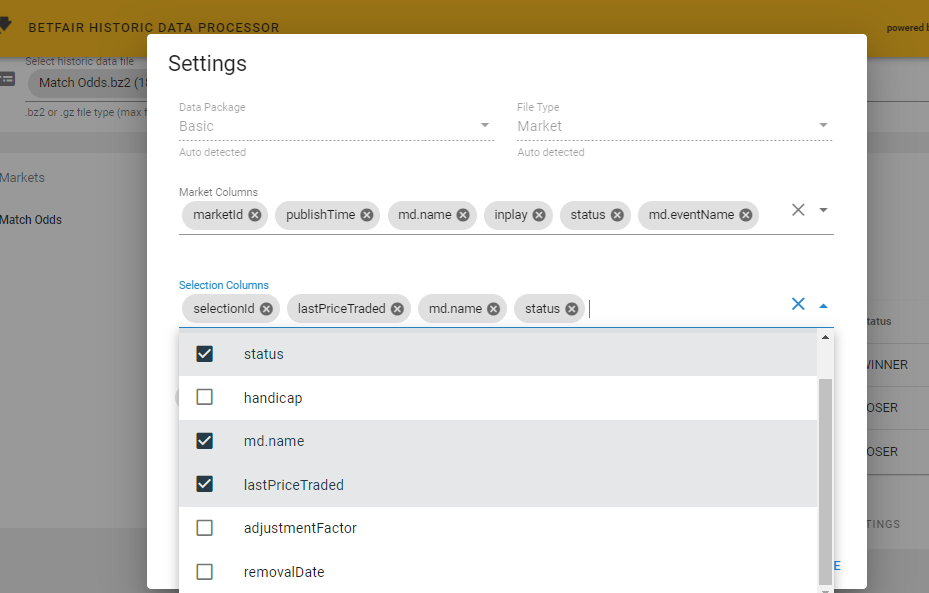
We now need to populate our spreadsheet with any relevant information we will need by clicking the drop down box arrow and selecting the fields by ticking the relevant tick boxes (dont worry if you put too much info into the spreadsheet as we can delete it later)
Once you have selected what you need close the drop down box by clicking the “up” arrow and because we are just interested in the in play data slide the “preplay” button to off as shown below and click save
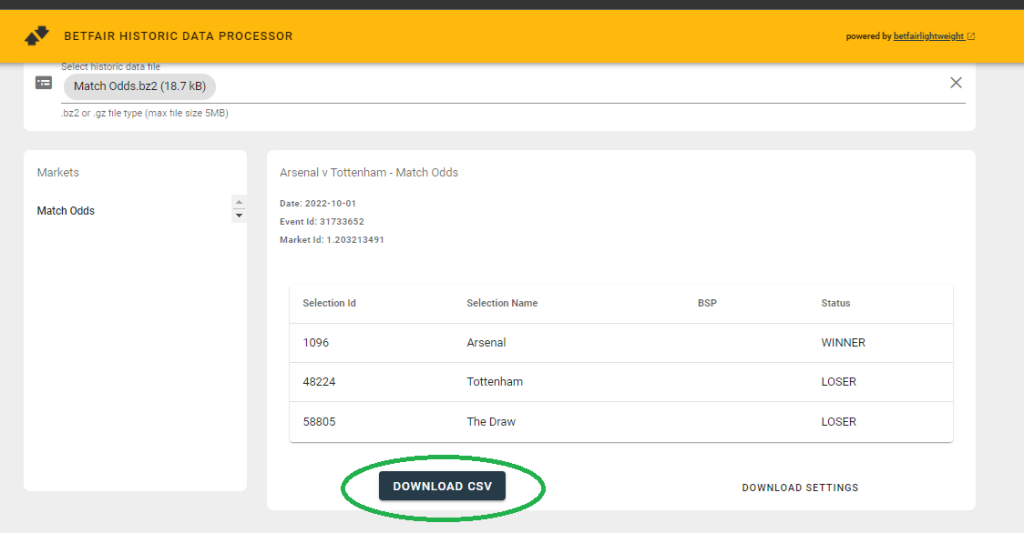
We are now ready to download the file as a CSV file into Excel we do this by simply clicking the “Download CSV” button as shown and let the wonders of better brains than our own do its stuff.
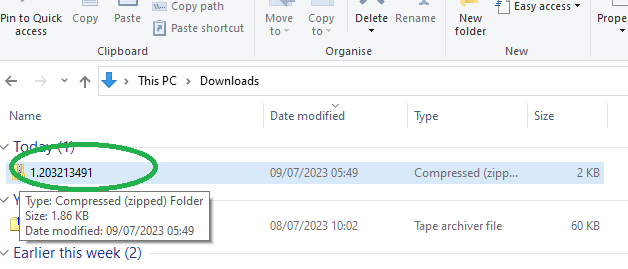
This will put a zipped file into your downloads folder with the original file number
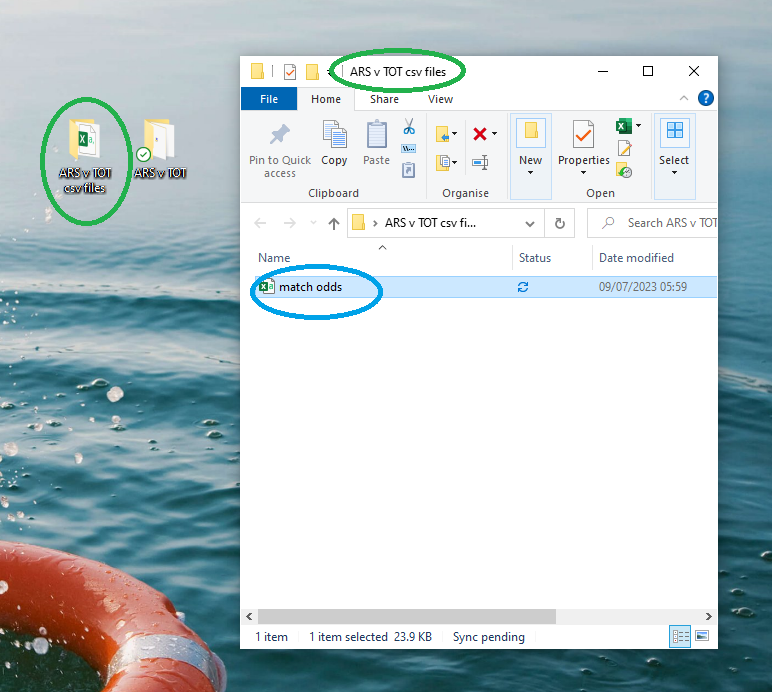
If we double click this file it will unpack and be available as a csv file which we can open with excel.

It may be a good idea to move this file to a new folder on your desktop and rename it as I have done here
If we open this in excel this is what we get.
We can now start to manipulate the data to best suit our needs. We can start by removing some of the columns we dont need. I have removed the following columns to be left with the following spreadsheet.
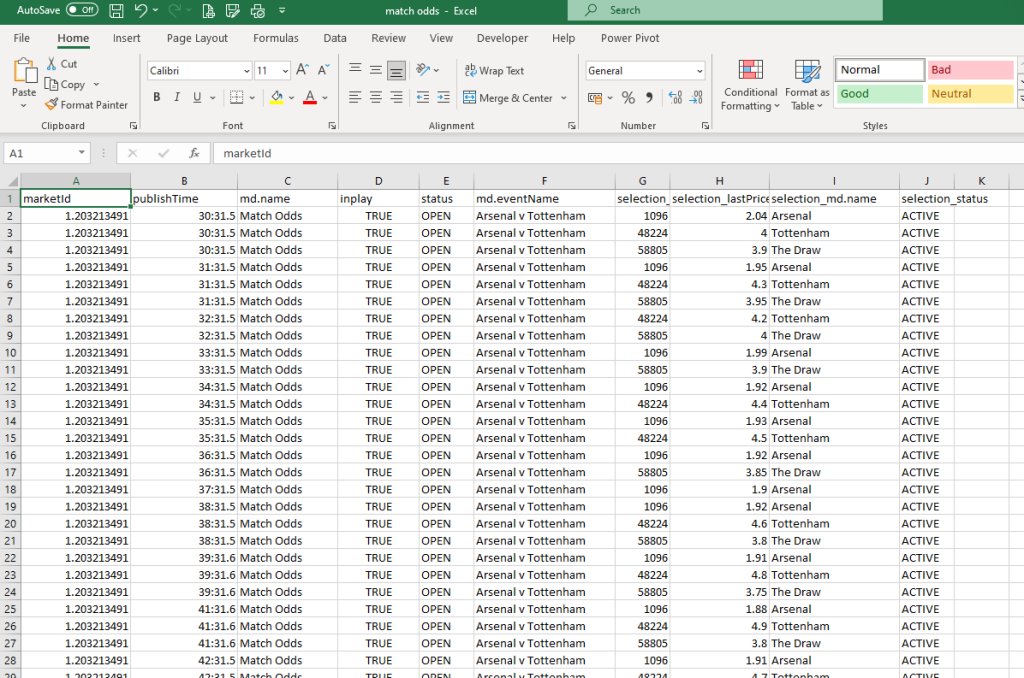
Market ID
Selection ID
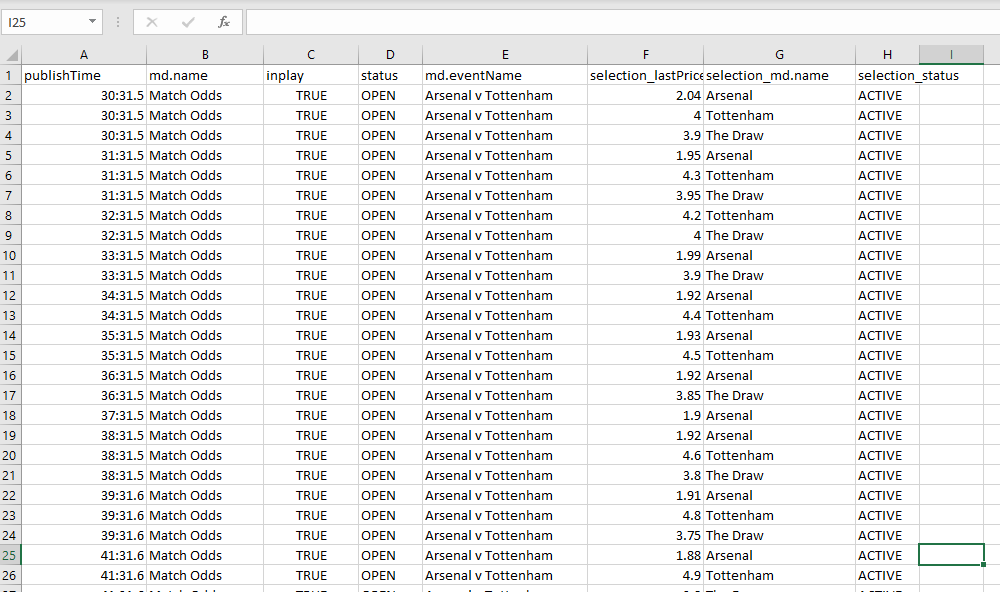
The next task is to make the published time more reader friendly. as you can see this is total jibberish, it means nothing. If you select cell A2, in the address window you will see that the full date and time is shown

So that column A shows the time in hrs and minutes we need to select hh:mm from the custom cell formats as shown below.
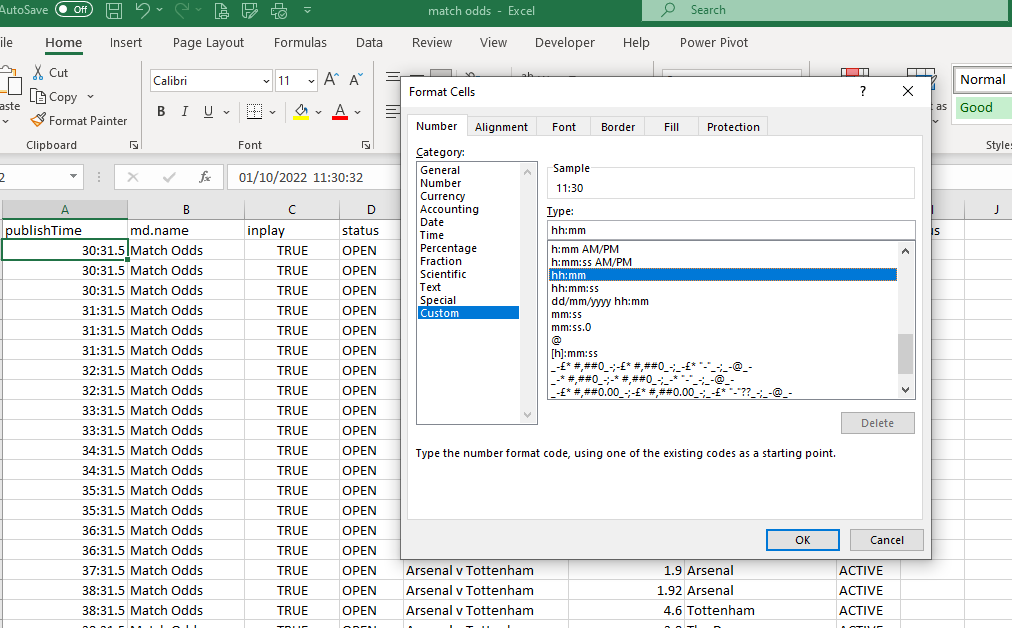
When we click ok then cell A2 will show the actual time of the published data for that row
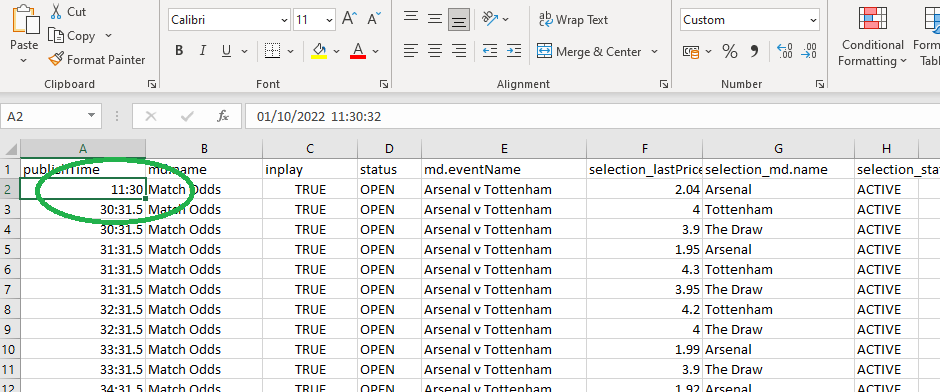
To convert all the row simply select Column A and repeat

When you click ok your spreadsheet should look like this
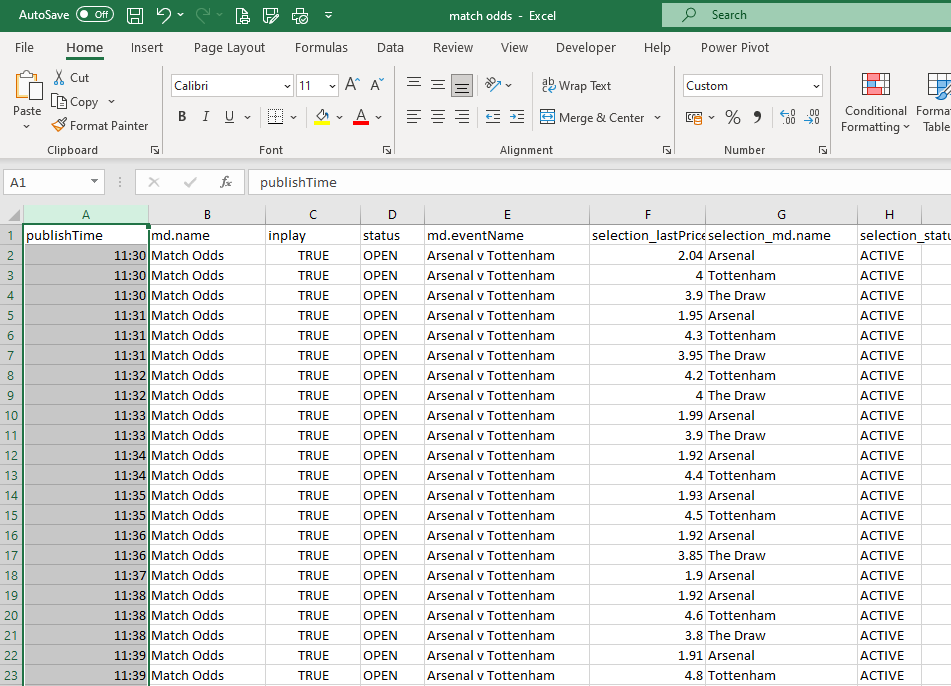
you will notice that the times are repeated 3 times this is because there are 3 separate outcomes within this betfair market – Arsenal to win The Draw and Tottenham to win.
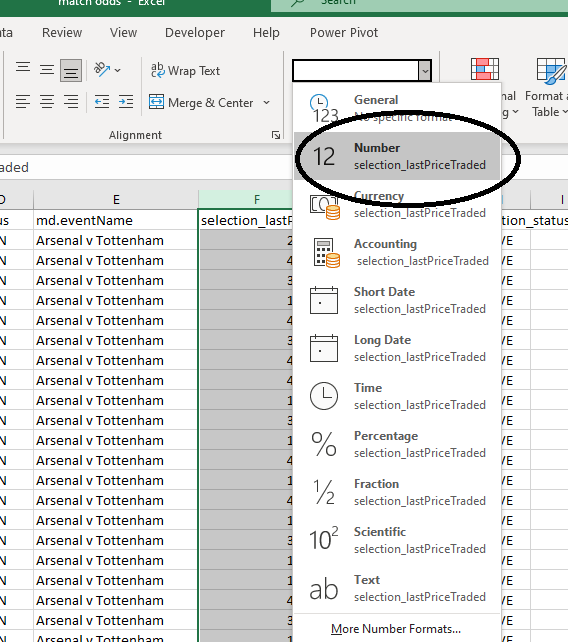
If we now draw our attention to Column F this is the last traded price column and we could do with tidying up this so that all the figures are shown to 2 decimal places. To do this simply select Column F and using the cell number format dropdown box, select “Number” as shown below.
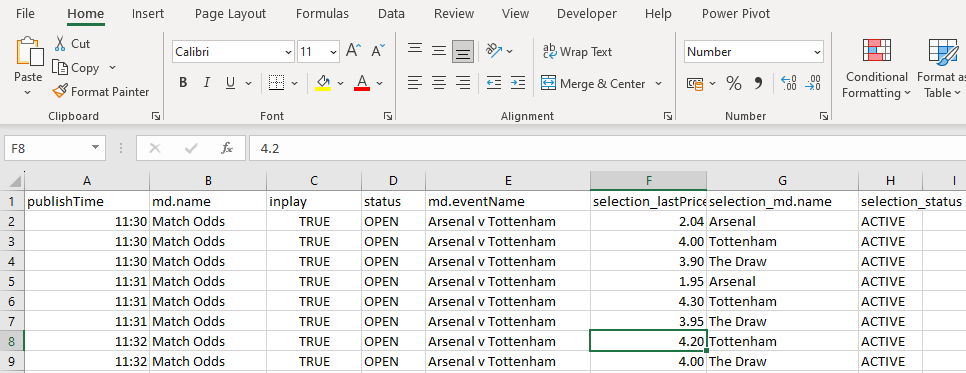
Your spreadsheet should now look something like this
A bit more tidying up by changing the column headers and this is what you should be looking at.

This is your basic data spreadsheet for the entire match for the Match Odds Market You can now save it into a folder and repeat the process with the other 5 markets
In my next post I will show you how to manipulate the data so that we can see what happened in each market as each goal went in

Please like and subscribe to my blog so that I can get a feel for what content can be most useful to you.