Before the year 2000 you would have to go back to 1962 to find a player out of the top 5 seeding in the ladies tournament that won. Since and including 2000 there have only been 10 players that were within the top 5 seeding that have won the ladies tournament. Where did these players fall by the wayside and what odds on the exchange could you lay them off at?
2024 saw 31 seed Krejcikova winning the tournament with a 2-1 victory over 7 seed Paolini, but the top 10 seeds started falling out in the 1st round with the dismissal of Zheng and Vondrousova with sportsbook odds of 1.17 and 1.13 respectively. Round 2 saw 5 seed Pegula lose to unseeded Wang, her sportsbook odds were 1.25. The third round was a disaster for the seeded players with 1 seed Swiatek (Odds 1.08), 9 seed Sakkari (Odds 2.2) , and 10 seed Jabeur (Odds 1.5) all crashing out. This left just 4 of the top 10 seeded players progressing into the 4th round which also saw casualties in the form of 2 seed Gauff (Odds 1.29) and 11 seed Collins (Odds 1.44). (I have included Collins at 11 seed because No 3 seed Sabalenka withdrew before round 1 and did not play in the tournament). Both remaining top 10 seeded players, seed 4 Rybakina and seed 7 Paolini made it safely through the quarter finals but the semi finals were the limit for seed 4 Rybakini (Odds 1.2) who lost to eventual winner Krejcikova. As mentioned before Paolini was the last of the top 10 seeds to fall and became tournament runner up with match odds of 2.2.
The implications of these events warrant some serious investigation into either backing the underdog at sportsbook odds if you haven’t got an exchange account or laying the seeded player on the exchanges.
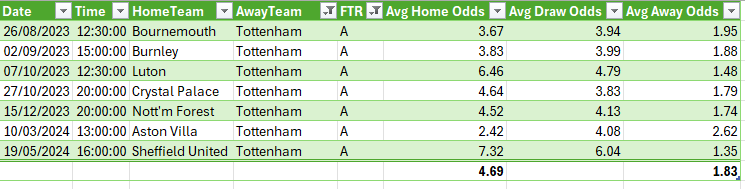
2024 Round 1 Matches
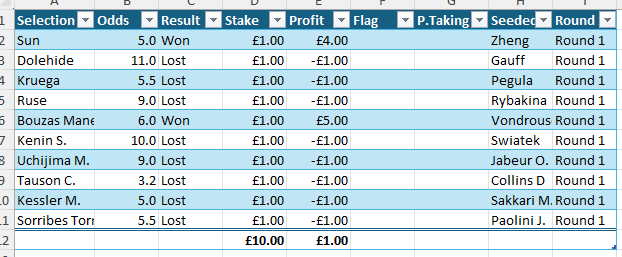
The table above shows the results and profit had you backed the underdog with Bet365 sportsbook for a £1.00 level stake. As you can see your profit would have been £1.00
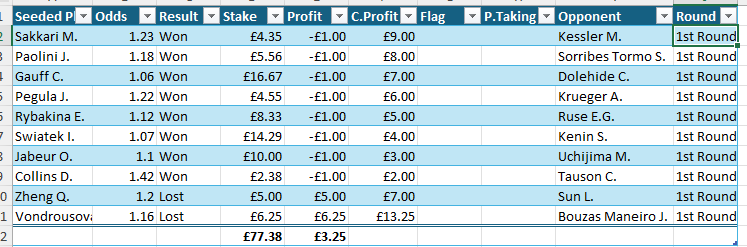
This second table shows the results and profit achieved when laying the top 10 seeded players for a £1.00 liability at the exchange with a 0% commission If you factor in a 2% commission then the profit would be £3.02 instead of £3.25.
2024 2nd Round Matches
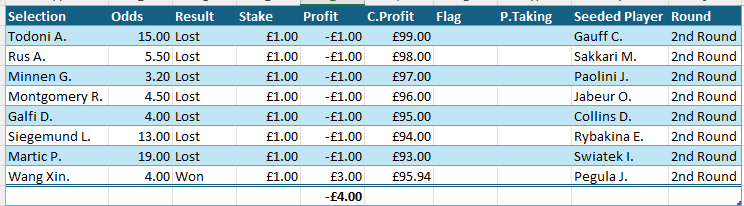
In the 2nd round just 1 seeded player was knocked out and the “underdog” for the match was Wang Xin who was 3/1. Total stakes for round 2 was £8.00 producing, after Wangs’ win, a total loss of £4.00. This brings our total P/L for the tournament if we were backing the opponent of the top 10 seeded players to -£3.00.

This table above shows the results if we had laid the remaining top 10 seed players. Our loss after 2% commission would be £3.74 giving a total loss of £3.72
2024 3rd Round Matches.
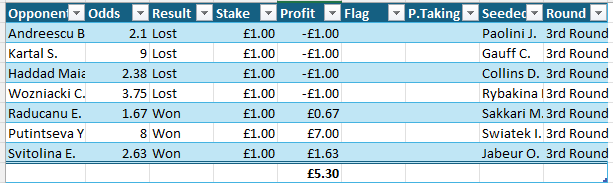
2024s’ 3rd round saw 3 of the top ten seeded players get knocked out including No 1 seed Swiatek which produced the highest individual profit of £7.00. The overall profit for round 3 backing the underdogs at Bet365 was £5.30 giving us an overall tournament profit of £2.30.
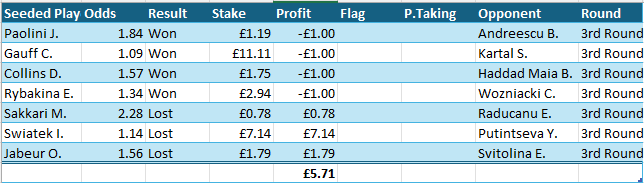
The dismissal of 3 of the remaining 7 top 10 seeded players has put our P/L back into the black with a 3rd round profit of £5.71 before commission deduction. With this factored in the 3rd round profit is £5.51 giving a tournament profit of £1.79
2024 4th Round Matches

The dismissal of both Gauff and Collins in round 4 would have given us a level stake profit of £2.50 backing the underdog at Bet365 the retirement of both Keys and Kalinskaya ensured safe passage to the Quarter Finals of the remaining 2 top ten seeds Paolini and Rybakina. With these two wins in this round our total tournament profit for backing the underdog now stands at £4.80.

Laying players at such short odds at the exchange has paid off in this round giving us an after commission profit of £3.10 adding to our tournament profit giving a total of £4.89
2024 Quarter Finals
Both of the remaining top 10 seeded players made it safely through to the semi finals reducing our Level stake profit when backing the underdog to £2.80. Laying the seeded players also had the same effect on our laying to a liability profit to £2.89 after commission.
2024 Semi Finals

Paolini triumphed in her semi final match against unseeded Vekic but backing Krejcikova to win against Rybakina paid dividends producing an overall semi final profit to £1.00 level stakes at Bet365 of £2.0 giving us an overall tournament profit with just the final to play of £5.30.

Again laying the seeded player instead of backing the underdog produced a greater profit before 25 commission was deducted even with the commission subtracted the profit is £3.28 giving a total tournament profit with just the final to play of £6.17
2024 The Final.

Backing the “Underdog” in the final at Bet365 produced a profit of 73p which when added to our tournament total for backing the underdog at £1.00 level stakes has given us a tournament grand total of £6.03
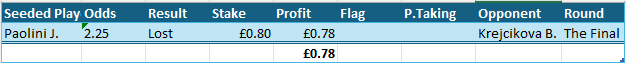
Laying the no 7 seed Paolini at odds of 2.25 has seemed the only sensible bet in the tournament given the odds of the eventual winner, Krejcikova, of 1.8 at the exchange. A profit of 78p was achieved after the reduction of 2% commission and when added to the tournament total for laying each and every one of the top ten seeded players produced an overall profit of £6.95. This is 92p more than backing the underdog at a sportsbook.
Analysis of the tournament.
Without doubt had we laid the top ten seeded players then our profit would have been more than backing the underdog at the bookmaker. However there is the fact that bookmakers need to create at least a 7% overound and we may well have benefited more by backing the underdog at an exchange especially if you have a promotional 0% commission. Without the top seeds falling by the wayside early on in the tournament the profit would have been less or even a loss might have occurred, certainly our profit was boosted by the single fact that Swiatek crashed out in the 3rd round!
Overall a success and in fact a low risk strategy. Laying to a liability of just £1.00 means that we can monitor and control any losses. We can make the lay bets in the knowledge that if we start with a small bank of just £10 and not let any emotion enter into our decisions we can keep this strategy fun.
How the seeded players faired in previous years.
2023
Top 10 Seeds
Swiatek – Lost in Round 4 (Odds 1.19)
Sabalenka – Lost in Semi Finals (Odds 1.7)
Rybakina – Lost in Quarter Finals (Odds 1.71)
Pegula – Lost in Quarter Finals (Odds 1.76)
Garcia – Lost in Round 3 (Odds 2.05)
Jabeur – Lost in The Final (Odds 1.5)
Gauff – Lost in round 1 (Odds 1.34)
Sakkari – Lost in round 1 (Odds 1.36)
Kvitova -Lost in Round 4 (Odds 1.8)
Krejcikova Lost in Round 2 (Odds 1.35)
Swiatek
Reached the 4th round where she lost to Svitolina After losing 3 lay bets at £1.00 each we would have won £5.26 giving a profit of £2.54
Sabalenka
Reached the Semifinals where she lost to Jabeur. After losing 5 lay bets at £1.00 each we would have won £1.43 giving a loss of £3.57
Rybakina
Reached the quarter finals were she lost to Jabeur. After 4 losing lay bets at £1.00 each we would have won £1.41 giving a loss of £2.59
Pegula
Reached the Quarter finals where she lost to Vondrousova. After losing 4 lay bets at £1.00 each we would have won £1.32 giving a loss of £2.68
Garcia
Reached the 3rd round where she lost to Bouzkova. After losing 2 lay bets at £1.00 each we would have won 96p giving a loss of £1.04
Jabeur
Reached the final where she lost to Vondrousova. After losing 6 lay bets at £1.00 each we would have won £2.00 giving a loss of £4.00
Gauff
Lost in the 1st round to Kenin. We would have won £2.94.
Sakkari
Lost in the 1st round to Kostyuk. We would have won £2.78
Kvitova
Reached the 4th Round where she lost to Jabeur. After losing 3 lay bets of £1.00 each we would have won £1.25 giving a loss of 1.75
Krejcikova
Reached the 2nd round where she lost to Andreeva. After just 1 losing lay bet of £1.00 we would have won £2.86 giving a profit of £1.86
Conclusion.
We would have lost £5.51 over the whole tournament this year if we had laid each of the top 10 seeds to the end.
2022
Top 10 seeds
Swiatek – Lost in Round 3 (Odds 1.2) – P/L £3.00
Kontaveit – Lost in Round 2 (Odds 1.50) – P/L £1.00
Jabeur – Reached the Final (Odds 1.83) – P/L -£4.80
Badosa – Reached the 4th Round (Odds 3.4) – P/L -£2.58
Sakkari – Reached the 3rd Round (Odds 1.20) – P/L £3.00
Pliskova – Reached the 2nd round (Odds 1.71) – P/L £0.41
Collins – Lost in the 1st Round (Odds 1.79) – P/L £1.27
Pegula – Reached the 3rd Round (Odds 1.57) – P/L -£0.25
Mugurusa – Lost in the 1st round (Odds 1.25) – P/L £4.00
Raducanu Reached the 2nd Round (Odds 1.70) – P/L £0.43
Conclusion
We would have Won £5.48 over the whole tournament this year if we had laid each of the top 10 seeds to the end.