The Staking Machine Software: Introducing Advanced Strategies – The Percentage Plan.

The “Percentage” staking plan is different to level stakes in the way you link the stake to your profit. With “The Staking Machine” software you can do some very clever things such as applying a different percentage to any profit and adding it to the base stake. In this post I will explore the myriad of settings to discover whether or not we can improve on the level stakes debarcle outlined in the main introductory post. If you have arrived here straight from google or some other entety other than the introduction post you can read it here

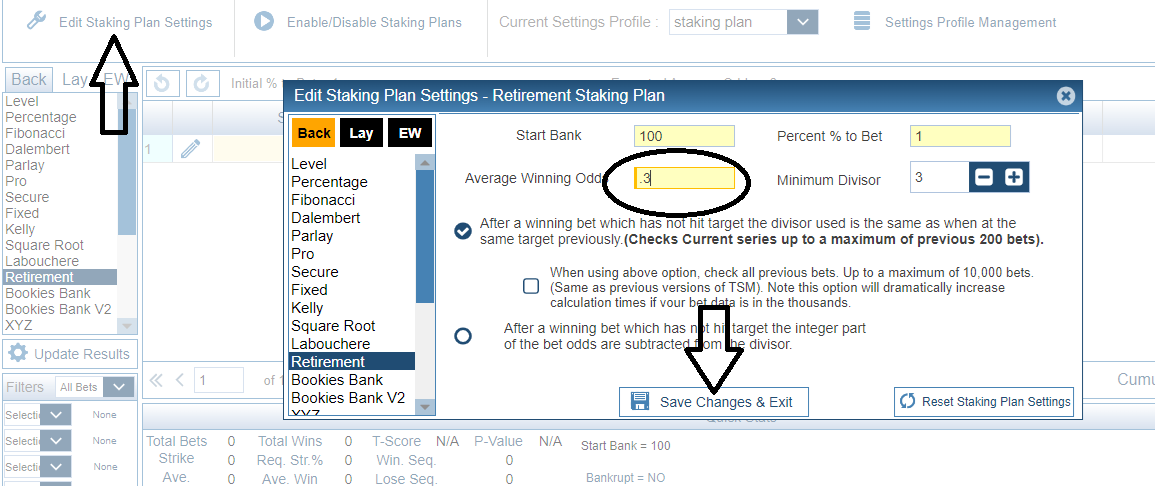
The first thing to do is to apply our desired settings to the relevant staking plan. To access this feature we click on the “Staking Plans” Tab at the top of the screen and then click the Edit Staking Plans Settings” button on the top left of the screen as shown below.

Accessing TSM staking plan settings.

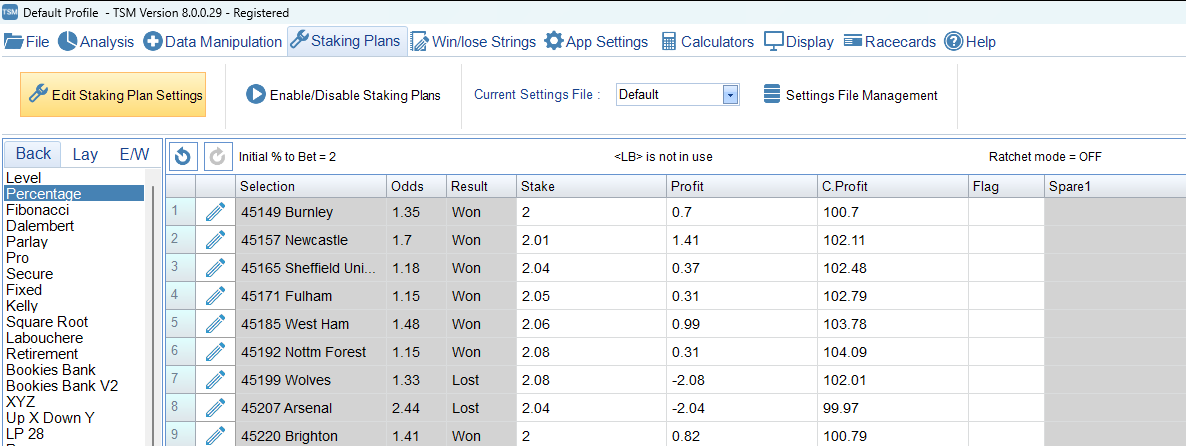
To begin with we should set our “bank” to the same as level stakes and the initial stake percentage the same. We are also going to set the minimum stake allowed to that of the initial start stake to make the staking machine calculate a stake that will never go below 2.00, this is done by ticking the box marked “Minimum Stake equals start stake” We are also going to tick the box “Re-calculate after x amount of bets” and enter 1 into the box. This will instruct TSM (The Staking Machine) to recalculate the stake after each bet. This can be seen more clearly in the screenshot of TSM below

Click the image to open in a new tab for a clearer view.

As you can see from the top image I have already loaded the data for last seasons Manchester Citys’ games and the software has calculated the stakes using the settings we have just entered, adusting the stakes for any profit or loss made. The same image is shown below and it clearly shows that when there was a profit made the stakes increased but when the cumulative profit became a loss the minimum stake rule kicked in and the minimum stake became £2.00. If we had left the “Minimum Stake Equals Start Stake” box unticked when Man City started losing you can see that the stakes reduced to 2% of our “Bank” – See bets 14 onwards shown below.

When the bank dips below its starting amount i.e. when you are no longer in profit TSM calculates the stake to 2% of the running bank if the minimum stake is unticked.

Because we are using the same data for level stakes as well as the percentage plan TSM can produce for us a graph that compares the two systems alonside each other. This is shown below.

A comparison of how the Percentage plan performed against level stakes using the initial settings determined above.

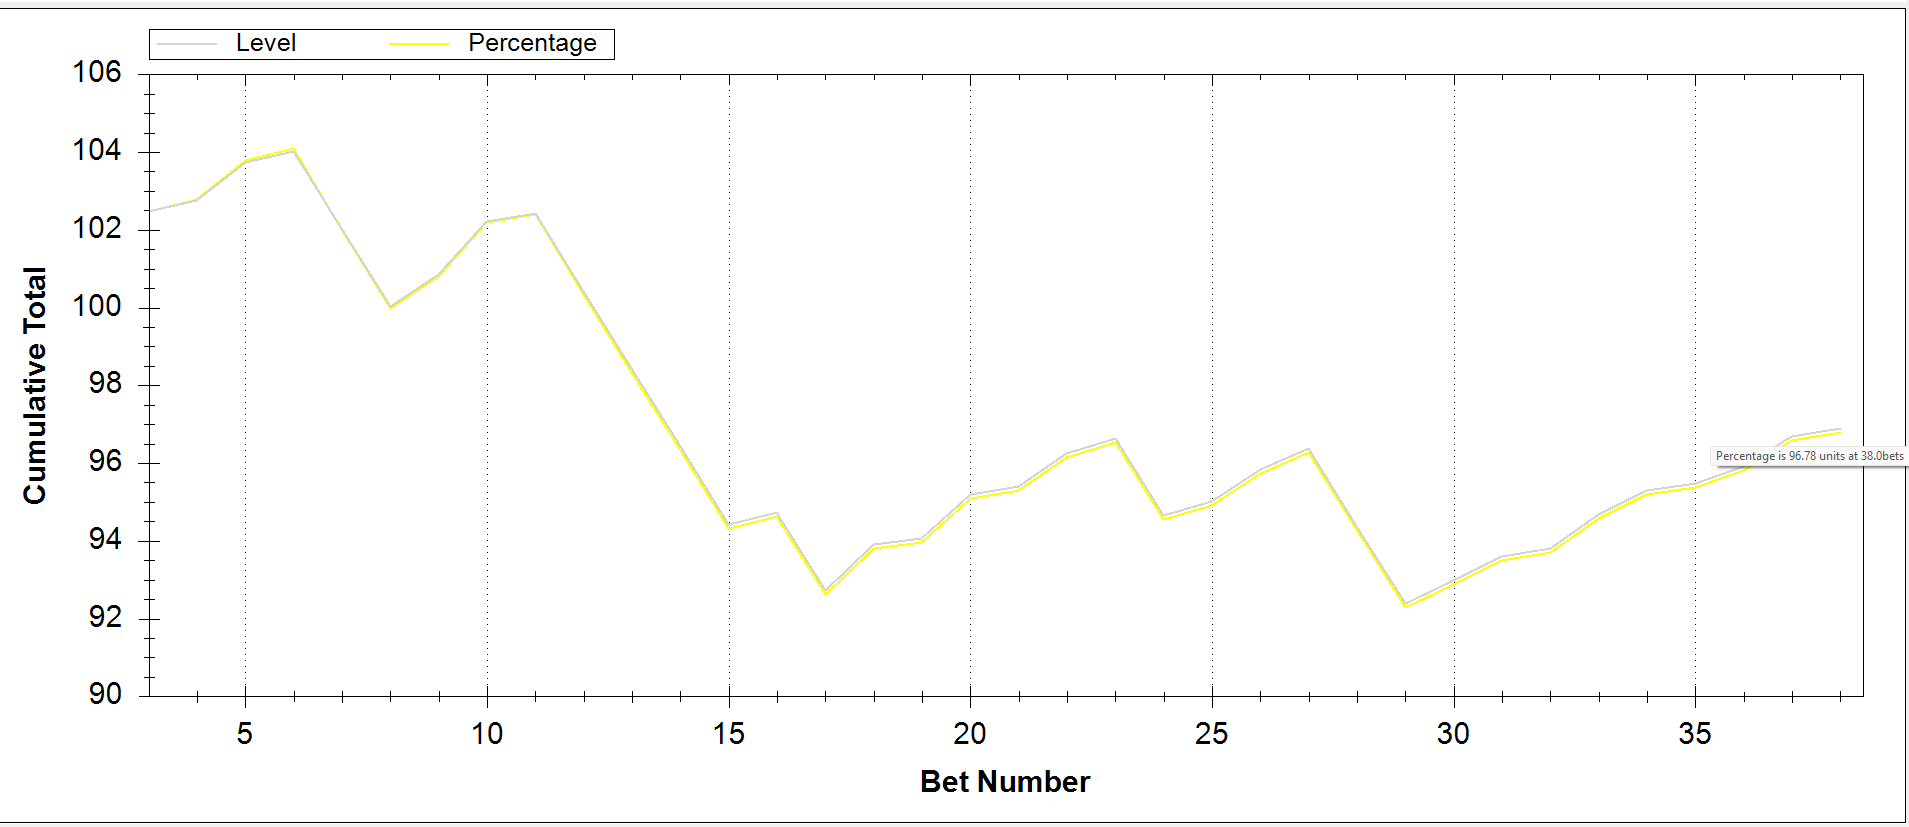
If you click the image above it will open in a new tab so that you can see from where i hovered my mouse above bet 38 on the percentage plan line that the plan ended with a further 10p loss compared with the level stakes plan. So on first impressions the percentage plan follows the level stakes plan very closely finishing with a very slight greater loss. There is however more setting that we can apply and one of these is to apply a different percentage to any profit and adding this to our base stake of £2.00 as the following shows. To turn this feature on we need to go back to our staking plan settings and tick the “Apply Different Percent % to Bet to any Profits” and enter the percent rate you would like to impement. I have entered 10%, this means that if we are £5 up it will add an additional 50p to the stake as shown below.

The following screenshot shows the increased stakes when this feature is implemented and the image immediately below that shows the normal percentage plan.

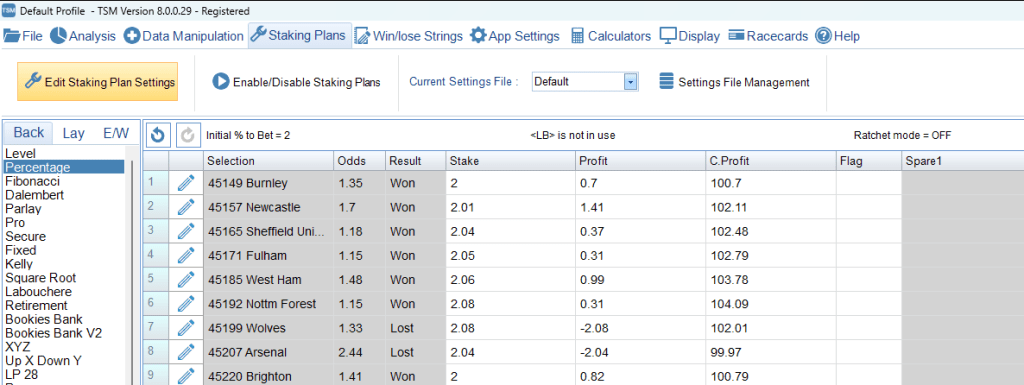
As you can see the percentage plan with the increased stakes the bank stands at £104.35 giving a profit of £4.35 where as the basic percentage plan the total is £104.09 or a £4.09 profit. When we start to lose however our increased stake means that on a losing bet the loss is greater. After Man City didn’t win the match against Wolves the basic plan shows a greater profit. If we get TSM to generate a new comparison graph using the new setting and compare it with level stakes the plans still follow similar paths but the percentage plan while rising above the level stakes plan at the end of the season it has under performed it by a further 40p loss.

Click image for a better view in a new tab

In quick summary for Manchester City it would seem that the percentage staking plan would not be suitable for bets involving very short odds even though the strike rate is quite high. What is becoming apparent is that if the strike rate is below the required strike rate determined by the average winning odds then you don’t stand much of a chance and it might be better to commit sacrilege and back your team to lose 😲. This we will explore later.

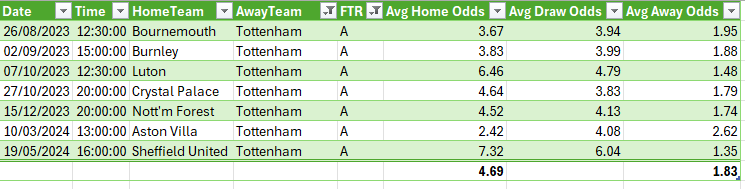
On to Tottenham and their creditable 5th place last season. As we saw in the introduction post Tottenham had a winning strike rate of 52.6% but their average winning odds of 1.81 dictated a required strike rate of 55.4% so even though the strike rate is still below the required strike rate can we recover losses with increased average odds or are we still doomed to failure and lining the bookies purse even more. The answer I am afraid is we lose even more than with the shorter odds.
The screenshot below (which is another great feature of TSM) shows the comparisons to a greater detail with totals such as highest peak profit and lowest trough loss

You will need to click the image to gain a better and clearer view of this screenshot – it will open in a new tab.

This feature is accessed by clicking the Analysis Comparison button on the main screen which will open in a new window the entire comparison stats for all the staking plans on the system – I have just shown the two that we are looking at so far.
If you click the image above it will open in a new tab so you can see more clearly the data it has produced
The first column shows the largest single stake used so you can get some idea of the stakes involved, With the level staking system the largest and smallests stakes are obviously going to show £2.00 as this is our level stake and that stands to reason. With the Percentage Staking plan with the settings described above the largest single stake was £3.39 and the smallest being £2.00 as we set our stake to be never below this figure or 2% of our starting bank which if you remember was £100.00. In the 5th Column it shows total stakes used and in this case the level staking plan used £76.00 as you would expect (38 games x £2.00). With the percentage plan our total stakes came out at £90.46 The most interesting column for us is the second to last which shows cumulative profit. This is our end of season figure and the Percentage plan under performs the level stakes by £2.80 with the cumulative profit being -£6.54. We can see this a lot clearer with the comparison graph below.

Performance of the Percentage staking plan against the level staking plan for Tottenham 23/24 season

As with the Manchester City analysis we can bring up a bar chart that identifies when Tottenham performed to the match odds this is shown below

This graph shows the number of matches that tottenham played where the win odds are grouped and the number of time they won in those ranges

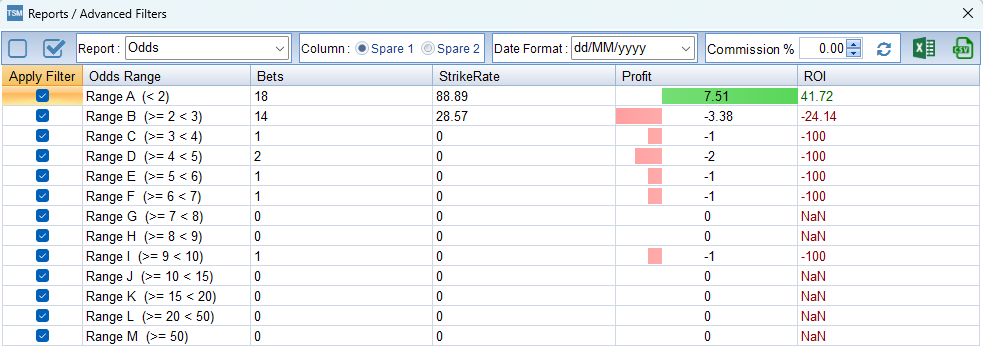
As you can see when the odds were below 1.5 Tottenham had a 100% strike rate. If we bring up the “Odds Report” we can see that the only grouping of odds where we would have made a profit was 2.0 and below.

Tottenhams strike rate when the match odds for them was below 2.0 was 88.89%

In summary then, using the percentage plan on matches that had win odds of 2.00 or below would have produced a profit of £7.51 over the season or a 41.07% Return on Investment.

We now move onto Crystal Palaces’ data and with £2.00 level stakes we would have profited by 11.48. If we remind ourselves Crystal Palaces winning strike rate was 34.2% for the 23/24 premiership season and they managed a creditable 10th place. Their average winning odds were 3.36 giving a required strike rate of 29.7%.
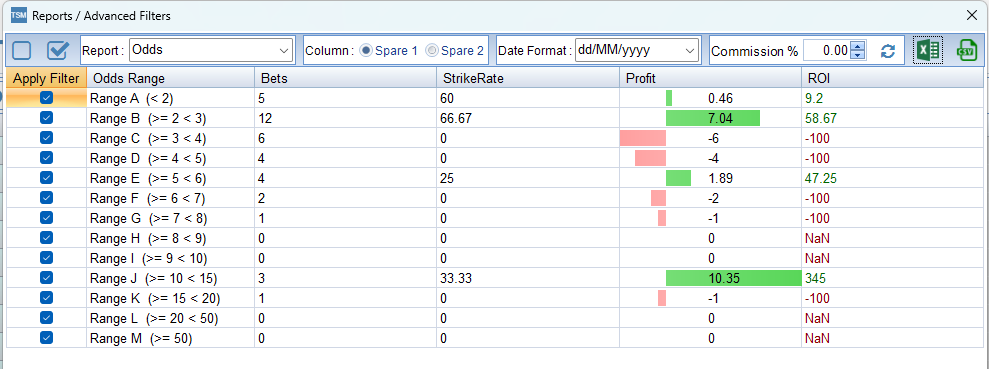
Using the Percentage Staking Plan with the settings unchanged from the two studies above our maximum single stake would have been £2.88 and again the lowest £2.00. There is another odds report that is available in TSM and the grouping of the odds is a lot more precise see below.

This report groups the odds into more precise bands.

Analysis of this kind can be invaluable as we can identify odds ranges that are more likely to provide a profit for instance if you look at the “Range F” row you will see that the odds range between 2.0 and 2.5 with a total of 10 games in that range with a 60% strike rate. If we tick the box in “Apply Filter” column and click the “Apply Chosen Filters” button at the bottom as shown in the screenshot below then it will populate the main TSM screen with just those results.

By filtering out other odds ranges we can analyse specific results.

By filtering out unwanted odds ranges we can make a more detailed analysis of specefic matches we would be better advised to bet on as shown below.

This screenshot shows just the matches where the match odds for Crystal Palace were just from match odds ranging from 2.0 to 2.5

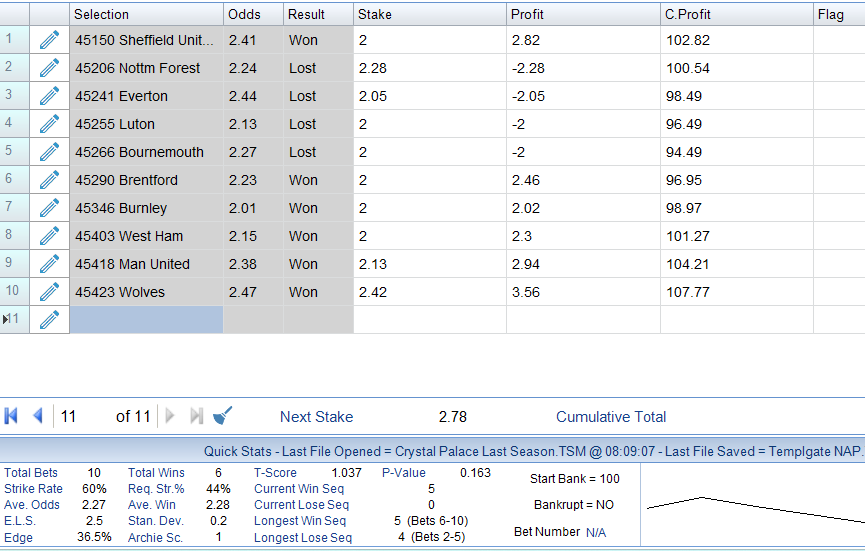
We can see from the quick stats panel at the bottom of the screen that the strike rate is 60% and the average winning odds from the 6 matches that Crystal Palace won came out at 2.28 requiring a strike rate of 44% to enable us to make a profit. Only backing matches that fall into this sort of odds ranges can make for a dull season but the aim of this small section where i have diverted from the bigger picture is that with detailed analysis such as this and the pure ease that TSM enables this you can analise all the teams in the premiership in this way – or any other league for that matter to improve your profit potential by having separate files for each team and using a plan for each such team individually.

Any way back to the full season comparison between level stakes and percentage plan for Crystal Palaces’ 23/24 season.

Comparison graph for Crystal Palace between Percentage and Level stakes staking plans.

This is the familiar comparison graph showing the track from bet 1 to bet 38 and as we have come to expect they follow each other very closely. In this particular instance the Level Staking plan out performed the percentage plan by 10p over the season.

In summary, generally the level stake staking plan is ahead as far as the ROI factor is concerned but there are factors that you should be aware of. Staking plans can, if the right research is done, provide profit where there is the right correlation between the Ave win odds and strike rates.

Discovering Profitable Staking Plans for Premiership Teams

There are many “get rich quick” schemes flying around and to many staking plans are typical of these and to others the holy grail of betting. In this feature I am going to look at and back test just some of the miriad of plans that are available, some you may have heard of and some you most definitely haven’t.
As with any thing that is potentially damaging to your bank balance rigorous testing should be undertaken before risking your money with the bookies. In this series of posts I will be using the “Staking Machine” website software to analyse the results from a set study of Premiership teams taken from last seasons finishing positions of top (Man City) 5th Place (Tottenham) and 10th Place (Crystal Palace)

What are staking plans? Essentially staking plans are a tool where you can use a pre determined equation to set your stake for the next bet in a sequence that you have chosen beforehand you would like to bet on. This could be following a racing tipster in your favourite newspaper to betting on a set trap number in greyhound racing. This post will focus on football and backing your favourite team through the season.

So which staking plan would you choose? The list is quite extensive and I will be analysing all of the plans that are on the staking machines website but to name just a few there is level, percentage, 1326, Fibonacci, Parley and the list goes on.
There are some basic things that you would need to input into the software for some of the plans and one of them is that it needs the average winning odds. This means the average of the odds where the selection won.
There is a section on the main software screen that shows strike rates, average winning odds average odds losing sequences and winning sequences a snap shot of which is shown below.

This is the quick stats snapshot from the data |I have entered for Crystal Palaces’ 23/24 season. Click to view a larger version in a new tab.


With last years football results this is easy as all the data can be downloaded from http://www.football-data.co.uk, which provides downloadable raw data from most leagues from around the world but in so much detail as regards to the domestic leagues you need to slim the excel sheets down a bit. What I will be using is the spreadsheet available below and filtering out the home and away results of the teams mentioned above to glean the average winning odds.

Man City’s Home odds when they won at home

The screenshot above shows Man City’s home wins and the average home win odds provided by http://www.football-data.co.uk
The screenshot below shows the matches where Man City were playing away from home and the average odds for an away win.

Man City’s away odds when they won when playing away

As you can see I have used the power of excel to determine the average of the average home win odds when they won and the average of the away odds when they won away from home and these are – Average winning Home odds 1.21 and the average winning away odds are 1.39 giving an over all average winning odds last season of 1.21 + 1.39 = 2.6
2.6/ 2 = 1.30

We can now enter this figure into the staking machine software. The rule for this is that you take the decimal odds of the average win odds and subtract 1 so the figure we enter into the winning odds box is 0.3

You can click the image above to open it in a new tab to make things clearer. Once this has been saved we can start entering the data from the spreadsheet. It should be noted at this point that the bank box is pre populated with £100 – you don’t physically need a £100 bank this is virtual all you need in your bookmaker account is the funds to make the next bet which is usually 1% of this i.e. £1.00. The demo mode of the software only allows you to input 10 results but I have subscribed so I can show you the full seasons bets.

Manchester city won 28 of their 38 league games last season (23/24) and subsequently finished league champions and everything that goes with this title but how did the devoted fan, who backs his team to win for £2.00 per week, fair? – Not too well to be honest. He would have lost £3.96 over the season. How can this be?

This graph shows the cumulative total using level stakes backing Manchester City to win throughout the season to a £1.00 level stake.


For a staking plan to work you need winners we all agree on that, but if the winners are at such a short price as Man City’s were then you need more winners. You may recall that the average “Winning Odds” for Man City last season was 1.3 this means that you would need a 76.8% strike rate to call a profit. Man City’s actual strike rate for last season was 73.7%. So Man City won the league and the bookies won the money- again!!!
This is just one instance where the advocates of level stake betting won’t turn a profit even though the strike rate is over 70%. There are however staking plans that will net you a profit but they are not life changing. I will explore these in more detail as time goes on but for now I will outline what would have happened if you had backed Tottenham throughout the season to win.
So again we first determine the winning odds for Tottenham by finding the average home winning odds and adding them to the away winning odds and dividing by 2. We can easily do this by filtering the data in excel as we did for Man City.

The average home winning odds are 1.79

Tottenham won 13 of their home games producing an average of 1.79 winning odds.

When playing away their strike rate was very much reduced and their winning odds averaged 1.83
If we add these together and divide by 2 we get : 1.79 +1.83 = 3.62 / 2 = 1.81

Plagued by bad luck or just better teams Tottenham achieved a winning strike rate of just 52.6% where in weeks 11 – 15 saw their longest losing streak. Average winning odds of 1.8 require a winning strike rate of 55.5%. So Again the bookies win and the fans wonder why when their team did so well in coming 5th in the table have, to a level stake of £2.00 on each game £5.00 less than when they started.

This graph shows the frequency of the odds grouped into values and how many matches they won at those ranged odds.

As you can see from the graph above when the odds were below 1.5 (7 in total) Tottenham won all of their games – as the odds suggest that they should have. the plan all starts to go pear shaped when the odds rise above 2.0 and more research might reveal that not backing Tottenham at these odds could improve the profit figure. The table below shows the ranges of odds and the profit/loss and a return on investment (ROI) had you just backed tottenham within these ranges. It should be noted that these figures are to a £1.00 level stake not £2.00

Click on the image to open in a new tab for a clearer look.

Finally on this post the results from 10th placed Crystal Palace. Crystal Palace had a total of 13 wins out of their 38 league matches giving a strike rate of 34.2%. Their average winning odds for these 13 games was 3.36 which required a strike rate of just 29.7% for all games over the season. This team would have made their fans a profit of £8.39 over the season if they had backed them to win with a level stake profit of £2.00

The following graphs and tables show in more detail the figures quoted above for Crystal Palace and the 23/24 season

Backing matches at “Bread and Butter” odds (1.5 – 3.0) would have shown a profit and 2 wins, one at odds between 5.5 and 6.0 and another at odds of above 10.0 and this can be better seen in the table below Again these figures show profit/loss to a £1.00 level stake.

Click to veiw in a new tab.


These are back tested results and show what would have happened if you had backed your team to level stakes and while not entirely picked at random for this study it does show that care needs to be taken when blindly backing at level stakes. Manchester city might have won nearly 3/4 of there league games but it was not enough to turn a profit
In the posts that follow I will be analysing the same 3 teams using a variety of staking plans to determine if there was a greater profit or a reduced loss to be made and still keep the betting enjoyable.

There is one more point I would like to make on the subject of strike rates and winning odds averages. The bookies know that if they are offering odds that are below the average winning odds then they are going to win. If you know about odds movement when a match is in play then you will realise that there are many times that you can back a team in play when the win odds of the team will rise above the average winning odds giving you the edge instead of them – There is of course the distinct possiblity that they may score early in the game!! These are all things that have to be considered and a risk assessment taken. Don’t be in such a hurry to lose your money!

The staking plans I will be using will be taken in the order listed on the staking machines software and after Level stakes the next plan is called “Percentage”. Below is a list of all the staking plans used which, when I have written the post will have a link attached so you can easily go straight to the post. Some of the plans I have never heard of and further reading on his site reveals that he himself has invented them.

Percentage
Fibonacci
Dalembert
Parlay
Pro
Secure
Fixed
Kelly
Square Root
Labouchere
Retirement
Bookies Bank
Bookies Bank v2
XYZ
Up X Down Y
LP 28
Recovery
Recovery Type 2
Recovery Type 3
SAW
Rolling Doubles
Coup Master
1 Point
i-TSM Plan