
Can a £200 Tennis Betting Bank Become a Profitable Strategy? What Our WTA Spreadsheet Actually Revealed

An exploration of favourites, underdogs, rankings, stake progression and promotional credit—and why the best-looking result is not always the best strategy.

By James Burnet | betornot.com

A betting spreadsheet can make almost any strategy look exciting if we ask enough questions. Narrow the odds, choose a particular round, select a tournament tier, increase the stakes—and eventually a striking profit figure appears.

But is that figure evidence of an advantage, or simply the result of finding a favourable pocket of history?

That was the question behind this workbook. We began with January match-price streams for four WTA players, then expanded the investigation to two season datasets. We tested backing and laying, ranking-based selections, odds bands, tournament rounds, different staking schedules and a £200 starting bank. Finally, we explored the effect of weekly and monthly promotional credit.

Some results were encouraging. Others were uncomfortable. The most useful finding was not a magic odds range: it was how differently the same rule could perform when the year, payout assumptions or staking schedule changed.

First, what did we actually test?

The initial files covered Coco Gauff, Iga Swiatek, Jessica Pegula and Marta Kostyuk. They contained 36 player–match records representing 34 distinct matches, including one doubles match. Shared matches were counted once in overall strategy totals.

The larger datasets contained:

  • 2025 season dataset: 2,505 match records, dated 29 December 2024 to 8 November 2025.
  • 2026 dataset: 2,457 match records, dated 4 January to 1 November 2026.

These are the dates and results supplied in the workbook, not independently verified match records. Neither dataset is a complete January-to-December calendar year. Opening-season December 2024 matches were retained in the 2025 dataset.

For the broader experiments, we used B365W and B365L: the supplied bookmaker prices for the eventual winner and loser. We excluded unfinished matches and invalid paired prices. Equal odds were excluded when choosing an odds favourite or underdog; ranking-based strategies instead required valid, unequal rankings.

Most simulations retained 6% commission on positive match profit to make the comparisons consistent. That is a modeling choice—not a statement that bookmaker back bets incur exchange commission.

The biggest limitation: bookmaker odds are not lay quotes

The January streams and season-level B365 data are different kinds of evidence. The latter do not tell us the first in-play price, the available exchange lay price, liquidity or whether an order would have matched.

A bookmaker back price cannot simply be assumed to be an executable exchange lay price. Consequently, the season-level lay profits in this article are hypothetical calculations at supplied prices, not proven trading returns.

This matters particularly when backing both sides produces losses but laying one side appears profitable. That apparent opportunity may reflect the assumed pricing rather than an advantage that can actually be traded.

£1 liability is not a £1 lay stake

For a lay bet, the liability is the maximum loss if the selected player wins. The stake is the amount won, before commission, if that player loses.

At odds of 1.20, a £1 liability requires a £5 lay stake:

Lay stake = liability ÷ (odds − 1).

If the player loses, the £5 profit becomes £4.70 after the modeled 6% commission. If the player wins, the loss is £1.

For a back bet, a £1 stake loses £1 if the player loses and earns £1 × (odds − 1) if the player wins.

Throughout the comparisons, ROI means net profit divided by total initial stakes or liabilities across bets—not return on the starting bank.

The first experiment: trade out, or hold to settlement?

Our original January idea was to lay a favourite at the first qualifying OPEN in-play update between 1.15 and 1.20, using £1 liability. The proposed exits were 1.50 for a profitable drift or 1.05 for a stop.

We modeled exact fills at those exit levels when subsequent OPEN prices crossed them. That assumption is important: an observed crossing does not establish that an order could have filled at the target price.

Across the 34 distinct matches, 25 entries qualified. Eleven reached the target, 13 reached the stop and one remained without a qualifying exit until settlement.

January strategyBetsNet P/LROI
Lay 1.15–1.20 and use modeled exits25£1.787.14%
Same entries, hold to settlement25−£5.03−20.11%
Lay the first OPEN in-play favourite, no odds filter34£5.9617.53%

The unrestricted opening-price test looked better, but two winning lays contributed £19.84. Without those two, the remaining bets lost £13.88.

This was our first warning: a profitable total can conceal heavy dependence on a very small number of outcomes.

Backing favourites and underdogs: winning frequently was not enough

The larger 2026 odds-based tests had 2,290 eligible matches.

Strategy, £1 initial risk per betNet P/LROI
Back the odds favourite−£119.50−5.22%
Back the odds underdog−£370.32−16.17%
Lay the odds favourite, £1 liability£90.143.94%

Favourites won 69.52% of those matches, yet backing them still lost money. Even before modeled commission, the loss was £82.57.

The lesson is straightforward: a high strike rate does not establish profitability. Prices and payouts matter as much as the number of winners.

The positive lay result needs the pricing caveat above. It must not be presented as proof that the exchange offered those same prices.

Rankings changed the selection—but did not remove the pricing problem

Using the match-supplied rankings, we defined the higher-ranked player as the one with the lower numeric rank. That player was not necessarily the odds favourite.

Across 2,349 eligible 2026 matches:

Ranking-based strategyNet P/LROI
Lay the higher-ranked player, £1 liability£174.287.42%
Back the lower-ranked player, £1 stake−£283.61−12.07%

Both strategies benefited from the same 846 match outcomes. They nevertheless had different returns because they used different prices and payout structures.

The timing also mattered. Higher-ranked lays earned £174.33 in January–June but were essentially break-even in July–November, losing £0.05. A strong overall number was therefore not evidence of an advantage sustained throughout the supplied period.

Quarterfinals stood out

Testing 435 intervals across the observed favourite odds identified 1.02–1.80 as the highest-total-profit range in the 2026 sample: £100.14 from 2,280 lays, or 4.39% ROI.

A range of 1.22–1.80 produced £88.00 from 1,805 lays, with a slightly higher 4.88% ROI. Removing its largest winning bet still left £83.73, so it was less dependent on one unusually large payout.

Breaking this range down by round revealed the following:

RoundBetsNet P/LROI
First round856£26.433.09%
Second round463−£20.22−4.37%
Third round130£14.3611.04%
Fourth round57−£0.04−0.06%
Quarterfinals173£62.9936.41%
Semifinals83−£4.34−5.23%
Finals43£8.8220.50%

Quarterfinals supplied most of the profit. Excluding the loss-making rounds would retrospectively have raised net profit to £112.59 and ROI to 9.37%.

However, those exclusions were selected after looking at the results. They are exploratory findings, not independently validated rules.

Were WTA500 quarterfinals the answer?

Within quarterfinals at 1.22–1.80, the 2026 tier comparison was striking:

TierBetsNet P/LROI
Grand Slam14−£1.37−9.77%
WTA100027£2.067.63%
WTA25078£23.4330.04%
WTA50054£38.8771.97%

WTA500 favourites lost 30 of 54 qualifying matches—55.6%. Those successful lays earned £62.87 after commission, offset by £24 of losses.

That explains the arithmetic. It does not explain the tennis. The workbook cannot establish that fatigue, motivation, scheduling or tournament importance caused those results.

Rankings did not provide a clean answer either. Most WTA500 quarterfinal profit came from favourites who were also better ranked: 47 bets produced £33.97. Rank-gap bands each contained only 11–15 bets, and their returns did not follow a simple consistent pattern.

The 2025 check changed the picture

Keeping the WTA500 quarterfinal rule at 1.22–1.80 unchanged produced:

DatasetBetsFixed £1 liability net P/LROI
202547£1.202.55%
202654£38.8771.97%

The 2025 result was only marginally profitable.

Narrowing the range to 1.22–1.50 made the contrast even clearer: 2025 lost £5.50 from 24 bets, while 2026 earned £27.00 from 27 bets.

This different-year check weakened the original conclusion. It was useful additional evidence, but not prospective validation: both datasets were historical, and we continued exploring them after seeing results.

A 20% increase after every tournament: impressive profits, alarming exposure

Next, we increased liability by 20% after each qualifying tournament, regardless of whether the previous event won or lost.

For WTA500 quarterfinals at 1.22–1.80, the 2026 progression earned £210.36. Yet the same approach lost £35.15 in 2025 and experienced an £80.91 tournament-end drawdown.

Expanding to all tiers and rounds at 1.20–1.40 made the exponential growth much more obvious:

DatasetFixed net P/LProgression net P/LFinal liability per bet
2025£30.70−£138,027.93£13,104.63
2026£11.65£103,759.63£9,100.44

These are uncapped simulations, not plans a £200 bank could fund. The 2025 tournament-end drawdown reached £157,780.37.

The progression did not make the selections more accurate. It gave later tournaments much more financial weight. Event overlap was also simplified: tournaments were indexed by first qualifying date, not actual completion-time bankroll availability.

What if liability increased monthly instead?

A monthly schedule was less explosive. New bets used 20% higher liability after each month-end, even inside a tournament; existing bets retained their original liability.

Each dataset restarted separately at £1 in its first qualifying month—December 2024 for the 2025 season and January 2026 for the 2026 dataset.

DatasetFixed £1 net P/LMonthly-growth net P/LMonthly-growth ROI
2025£30.70−£6.98−0.30%
2026£11.65£11.980.64%

The smaller escalation reduced exposure dramatically, but did not consistently improve the result. Fixed liability had the higher ROI in both datasets.

Could a £200 bank survive?

For the monthly-growth strategy at 1.20–1.40, the 2026 cumulative result fell £183.63 below its starting balance.

Assuming all bets on a day had to be funded before any settled—and all earlier dates had already settled—the historical starting-bank requirement was £196.53. Starting with £200 left just £3.47 free at the tightest point.

On 24 September 2026, previous losses were £175.03 and that day’s liabilities totaled £21.50. Together, they explain the £196.53 requirement.

A fresh £200 bank survived each year’s replay separately, ending at £193.02 in 2025 and £211.98 in 2026. This was not a test of one continuously carried bank under that monthly progression.

Nor is it a guarantee. Actual entry and settlement timestamps were missing. Multi-day unsettled bets could require more funding, and future losses could exceed the historical maximum.

Promotional credit: a different source of apparent profitability

The final experiment returned to fixed £1 liability, all tiers and rounds, favourite odds 1.22–1.80, and one cash bank carried between datasets.

Starting cash was £200. The modeled offers were £10 each Monday and £3 on the first of each month, usable for lay liability. Promotional credit was used before cash.

Under the chosen assumptions:

Result2025 dataset2026 dataset
Bets1,8311,805
New promotional credit£483.00£460.00
Cash winnings after commission£1,254.79£1,242.00
Cash-funded losses£699.00£694.00
Closing cash bank£755.79£1,303.79

The final £1,303.79 bank can be reconciled as:

£200 starting cash + £162.79 strategy profit + £941 of losses absorbed by promotional credit.

A further £2 of unused credit was kept separate from cash.

This is conditional, not a verified Betfair offer conversion. We assumed unused credit did not expire, winning lays released the promotional liability for reuse, winnings became cash and losses consumed the credit. The offer’s detailed terms were not confirmed. No qualifying-spend costs were included.

We also added no allowances during the missing 9 November 2025–3 January 2026 gap. This was not a full 104-week simulation.

The distinction is crucial: a promotional subsidy is not the same thing as a predictive trading advantage.

What would I take forward?

The workbook suggests a research candidate, not a ready-made money-making system. Quarterfinal favourite lays at 1.22–1.80 deserve further observation, but WTA500’s much weaker 2025 result prevents a confident claim of repeatability.

A sensible next experiment would freeze the selection rule and use paper trades at actual available exchange prices. It should record entry times, odds, available liquidity, fills, commission, settlement and rejected orders. Retirement treatment should be defined before testing rather than inferred after the result.

Keep liability fixed during that experiment. Do not escalate it simply because a month or tournament has ended.

Set a review point in advance—such as 100 qualifying paper bets—while recognising that a round number does not guarantee statistical reliability.

Review profit concentration, drawdown and performance by period, not just final ROI. Avoid repeatedly changing the rule to rescue a disappointing run: that produces another retrospective fit rather than a fair test.

The verdict: useful evidence, not a shortcut

This investigation showed why comparing strategies matters.

Backing frequently winning favourites still lost money. A highly profitable-looking quarterfinal filter weakened in another year. Stake increases amplified the ordering of results. A £200 bank could survive one modeled replay while leaving almost no funding margin. Promotional credit improved the cash outcome largely by paying for losses.

The most valuable result is therefore a better framework for asking questions:

Are the prices executable? Is the profit repeatable? What funds the losses? How much cash is tied up? And did we choose the rule before or after seeing the winners?

Until those questions have credible answers, a spreadsheet profit is a reason to investigate—not a reason to increase stakes.


Editorial disclosure

All figures above are retrospective workbook calculations using supplied match data. They are not independently verified sporting records, actual account statements or guaranteed betting returns. Figures are rounded for display.

Specific promotional terms have not been independently verified. The promotional-credit outcome depends on the assumptions stated in the article.

Betting can cause financial harm. Do not use essential funds, borrowing or automatic stake escalation to pursue losses.

Betting Trends at Wimbledon: Analyzing Top Seed Losses

Before the year 2000 you would have to go back to 1962 to find a player out of the top 5 seeding in the ladies tournament that won. Since and including 2000 there have only been 10 players that were within the top 5 seeding that have won the ladies tournament. Where did these players fall by the wayside and what odds on the exchange could you lay them off at?
2024 saw 31 seed Krejcikova winning the tournament with a 2-1 victory over 7 seed Paolini, but the top 10 seeds started falling out in the 1st round with the dismissal of Zheng and Vondrousova with sportsbook odds of 1.17 and 1.13 respectively. Round 2 saw 5 seed Pegula lose to unseeded Wang, her sportsbook odds were 1.25. The third round was a disaster for the seeded players with 1 seed Swiatek (Odds 1.08), 9 seed Sakkari (Odds 2.2) , and 10 seed Jabeur (Odds 1.5) all crashing out. This left just 4 of the top 10 seeded players progressing into the 4th round which also saw casualties in the form of 2 seed Gauff (Odds 1.29) and 11 seed Collins (Odds 1.44). (I have included Collins at 11 seed because No 3 seed Sabalenka withdrew before round 1 and did not play in the tournament). Both remaining top 10 seeded players, seed 4 Rybakina and seed 7 Paolini made it safely through the quarter finals but the semi finals were the limit for seed 4 Rybakini (Odds 1.2) who lost to eventual winner Krejcikova. As mentioned before Paolini was the last of the top 10 seeds to fall and became tournament runner up with match odds of 2.2.

The implications of these events warrant some serious investigation into either backing the underdog at sportsbook odds if you haven’t got an exchange account or laying the seeded player on the exchanges.

2024 Round 1 Matches

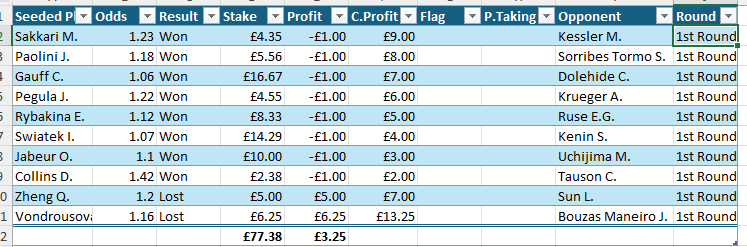
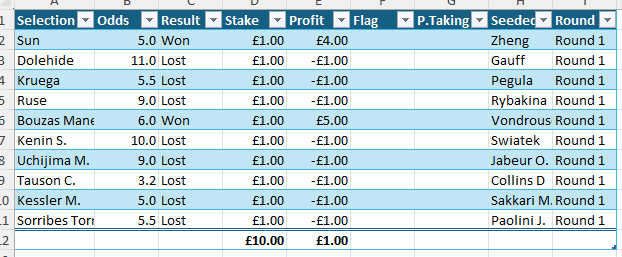
Wimbledon 1st round matches backing the underdog at £1.00 level stakes

The table above shows the results and profit had you backed the underdog with Bet365 sportsbook for a £1.00 level stake. As you can see your profit would have been £1.00

Wimbledon 1st round matches laying the top 10 seeded players.

This second table shows the results and profit achieved when laying the top 10 seeded players for a £1.00 liability at the exchange with a 0% commission If you factor in a 2% commission then the profit would be £3.02 instead of £3.25.

2024 2nd Round Matches

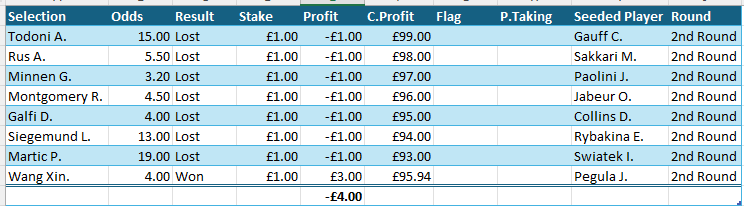
Wimbledon 2nd Round Backing the Underdog at £1.00 Level Stakes

In the 2nd round just 1 seeded player was knocked out and the “underdog” for the match was Wang Xin who was 3/1. Total stakes for round 2 was £8.00 producing, after Wangs’ win, a total loss of £4.00. This brings our total P/L for the tournament if we were backing the opponent of the top 10 seeded players to -£3.00.

Wimbledon 2nd round matches laying the remaining top 10 seeded players for a £1.00 liability

This table above shows the results if we had laid the remaining top 10 seed players. Our loss after 2% commission would be £3.74 giving a total loss of £3.72

2024 3rd Round Matches.

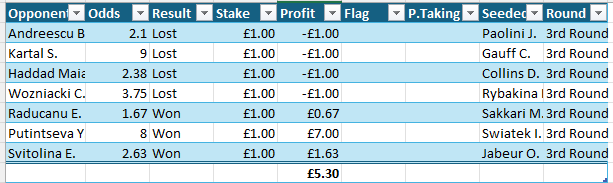
Wimbledon 3rd round matches Backing the underdog for a £1.00 level Stake

2024s’ 3rd round saw 3 of the top ten seeded players get knocked out including No 1 seed Swiatek which produced the highest individual profit of £7.00. The overall profit for round 3 backing the underdogs at Bet365 was £5.30 giving us an overall tournament profit of £2.30.

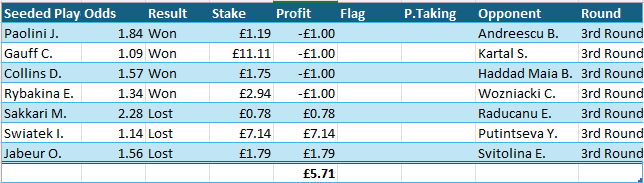
Wimbledon 3rd round matches laying the remaining top 10 seeded players to £1.00 liability

The dismissal of 3 of the remaining 7 top 10 seeded players has put our P/L back into the black with a 3rd round profit of £5.71 before commission deduction. With this factored in the 3rd round profit is £5.51 giving a tournament profit of £1.79

2024 4th Round Matches

Wimbledon 4th round matches backing the underdog at £1.00 level stakes

The dismissal of both Gauff and Collins in round 4 would have given us a level stake profit of £2.50 backing the underdog at Bet365 the retirement of both Keys and Kalinskaya ensured safe passage to the Quarter Finals of the remaining 2 top ten seeds Paolini and Rybakina. With these two wins in this round our total tournament profit for backing the underdog now stands at £4.80.

Wimbledon 4th round matches laying the remaining 4 top 10 seeds to a liability of £1.00.

Laying players at such short odds at the exchange has paid off in this round giving us an after commission profit of £3.10 adding to our tournament profit giving a total of £4.89

2024 Quarter Finals

Both of the remaining top 10 seeded players made it safely through to the semi finals reducing our Level stake profit when backing the underdog to £2.80. Laying the seeded players also had the same effect on our laying to a liability profit to £2.89 after commission.

2024 Semi Finals

Wimbledon 2024 Semi Final Matches showing the backing of the underdog at £1.00 level stakes

Paolini triumphed in her semi final match against unseeded Vekic but backing Krejcikova to win against Rybakina paid dividends producing an overall semi final profit to £1.00 level stakes at Bet365 of £2.0 giving us an overall tournament profit with just the final to play of £5.30.

Semi final matches involving the remaining 2 top ten seeded players when laying to a £1.00 liability.

Again laying the seeded player instead of backing the underdog produced a greater profit before 25 commission was deducted even with the commission subtracted the profit is £3.28 giving a total tournament profit with just the final to play of £6.17

2024 The Final.

The Final for Wimbledon 2024 where 31 seed Krejcikova beat 7th Seed Paolini 3/6 6/3 6/4

Backing the “Underdog” in the final at Bet365 produced a profit of 73p which when added to our tournament total for backing the underdog at £1.00 level stakes has given us a tournament grand total of £6.03

Laying the seeded player paid off again giving a small profit after commission of 78p

Laying the no 7 seed Paolini at odds of 2.25 has seemed the only sensible bet in the tournament given the odds of the eventual winner, Krejcikova, of 1.8 at the exchange. A profit of 78p was achieved after the reduction of 2% commission and when added to the tournament total for laying each and every one of the top ten seeded players produced an overall profit of £6.95. This is 92p more than backing the underdog at a sportsbook.

Analysis of the tournament.

Without doubt had we laid the top ten seeded players then our profit would have been more than backing the underdog at the bookmaker. However there is the fact that bookmakers need to create at least a 7% overound and we may well have benefited more by backing the underdog at an exchange especially if you have a promotional 0% commission. Without the top seeds falling by the wayside early on in the tournament the profit would have been less or even a loss might have occurred, certainly our profit was boosted by the single fact that Swiatek crashed out in the 3rd round!
Overall a success and in fact a low risk strategy. Laying to a liability of just £1.00 means that we can monitor and control any losses. We can make the lay bets in the knowledge that if we start with a small bank of just £10 and not let any emotion enter into our decisions we can keep this strategy fun.

How the seeded players faired in previous years.

2023

Top 10 Seeds

Swiatek – Lost in Round 4 (Odds 1.19)
Sabalenka – Lost in Semi Finals (Odds 1.7)
Rybakina – Lost in Quarter Finals (Odds 1.71)
Pegula – Lost in Quarter Finals (Odds 1.76)
Garcia – Lost in Round 3 (Odds 2.05)
Jabeur – Lost in The Final (Odds 1.5)
Gauff – Lost in round 1 (Odds 1.34)
Sakkari – Lost in round 1 (Odds 1.36)
Kvitova -Lost in Round 4 (Odds 1.8)
Krejcikova Lost in Round 2 (Odds 1.35)

Swiatek
Reached the 4th round where she lost to Svitolina After losing 3 lay bets at £1.00 each we would have won £5.26 giving a profit of £2.54
Sabalenka
Reached the Semifinals where she lost to Jabeur. After losing 5 lay bets at £1.00 each we would have won £1.43 giving a loss of £3.57
Rybakina
Reached the quarter finals were she lost to Jabeur. After 4 losing lay bets at £1.00 each we would have won £1.41 giving a loss of £2.59
Pegula
Reached the Quarter finals where she lost to Vondrousova. After losing 4 lay bets at £1.00 each we would have won £1.32 giving a loss of £2.68
Garcia
Reached the 3rd round where she lost to Bouzkova. After losing 2 lay bets at £1.00 each we would have won 96p giving a loss of £1.04
Jabeur
Reached the final where she lost to Vondrousova. After losing 6 lay bets at £1.00 each we would have won £2.00 giving a loss of £4.00
Gauff
Lost in the 1st round to Kenin. We would have won £2.94.
Sakkari
Lost in the 1st round to Kostyuk. We would have won £2.78
Kvitova
Reached the 4th Round where she lost to Jabeur. After losing 3 lay bets of £1.00 each we would have won £1.25 giving a loss of 1.75
Krejcikova
Reached the 2nd round where she lost to Andreeva. After just 1 losing lay bet of £1.00 we would have won £2.86 giving a profit of £1.86

Conclusion.


We would have lost £5.51 over the whole tournament this year if we had laid each of the top 10 seeds to the end.

2022

Top 10 seeds

Swiatek – Lost in Round 3 (Odds 1.2) – P/L £3.00
Kontaveit – Lost in Round 2 (Odds 1.50) – P/L £1.00
Jabeur – Reached the Final (Odds 1.83) – P/L -£4.80
Badosa – Reached the 4th Round (Odds 3.4) – P/L -£2.58
Sakkari – Reached the 3rd Round (Odds 1.20) – P/L £3.00
Pliskova – Reached the 2nd round (Odds 1.71) – P/L £0.41
Collins – Lost in the 1st Round (Odds 1.79) – P/L £1.27
Pegula – Reached the 3rd Round (Odds 1.57) – P/L -£0.25
Mugurusa – Lost in the 1st round (Odds 1.25) – P/L £4.00
Raducanu Reached the 2nd Round (Odds 1.70) – P/L £0.43

Conclusion

We would have Won £5.48 over the whole tournament this year if we had laid each of the top 10 seeds to the end.

Betting Insights: Analyzing Provisional Odds for Winners

Yesterday I showed you how to create a basic query in TSMs’ Selection Hunter to find some likely winners using the back test mode to discover any trends and it came up with the following 3 horses
The selections are
13:50 Stage Star
14:25 Copperhead
15:00 Sunray Shadow.

If you missed it you can read the post here


13:50 Stage Star
Stage Star met the provisional odds criteria of between 2.00 and 2.99 but went off at a BSP of 3.21. Our conditions of placing a bet with betangel were that the BSP had to be between 2.00 and 2.99 for the software to trigger. 3.21 was out of our range at 3.21 so no bet was made.

Stage Star only managed 4th out of 5

14:25 Copperhead
Joe Tizzards’ Copperhead also qualified as the provisional odds were posted as 2.85 but again the BSP was outside of the criteria and went off at 3.5 giving us another miss fire from Betangel.
Copperhead Won by 14 lengths!!!

15:00 Sunray Shadow
The final selection was the Skelton trained and ridden Sunray Shadow who’s Provisional odds were posted at 2.5. Winning by a length and a 1/4 the BSP was well within the range at 2.23 and Betangel Fired the bet in 10 seconds before post time catching 2.25

Summary
2 of the 3 selections went off at odds outside the criteria one of them winning but alas one losing
2 of the 3 went off as favourites despite all 3 being ranked as provisional favourite.
Betangel fired just one bet and this returned 125% ROI
Given the strike rate of the criteria when back tested (68%) 2 actual winners from our query seemed to tentatively back this trend.

Cautionary note
While this was a completely genuine test run you should not go out and back every Aintree runner with a BSP of between 2.0 and 2.99 even though I back tested over a period of nearly 2 years results you should always do as much research as you can and start with stakes that you can afford to lose.

Build your bank steadily Racing is not going to finish tommorrow!!!

The staking Machine software has limited use for free but If you want to take advantage of the Selection Hunter you will need to pay – It only costs £24 for 1 year – Twenty Four!! this is not a typo and can be paid via paypal
That’s only 2 quid a month and if you had backed Sunray Shadow for a quid you would have made over 1/2 a months subscription already.

How to Use TSM’s Selection Hunter for Racing Queries

There is a new addition to the TSM armoury called the Selection Hunter and it does exactly what it says! By entering criteria in a series of easy to use drop boxes in its user interface you can quickly build a module/query that shows the runners for today.
As a demonstration I will build a query for todays racing at Aintree using the backtest mode and then post the selections before racing starts.
We need to open the selection hunter first and this is achieved by opening TSM and then clicking on the racecards tab at the top and then clicking on the “UK/IRE Horse Racing Selection Hunter” shown below.

This will open the selection Hunter Interface as shown below.

As you can see I have already produced some queries but for this demonstration I will start from scratch.

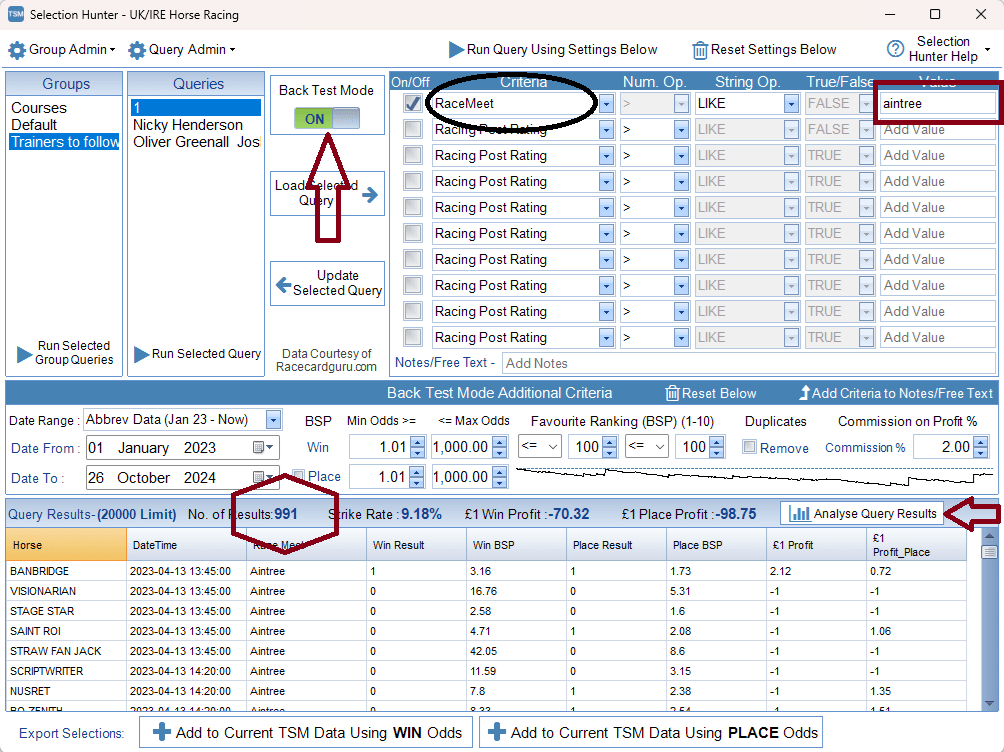
To start a new query click the first tick box and then, under criteria, select RaceMeet from the first dropdown box make sure “Like” is populated in the String Op box and Type the race course name into the value box as shown below.

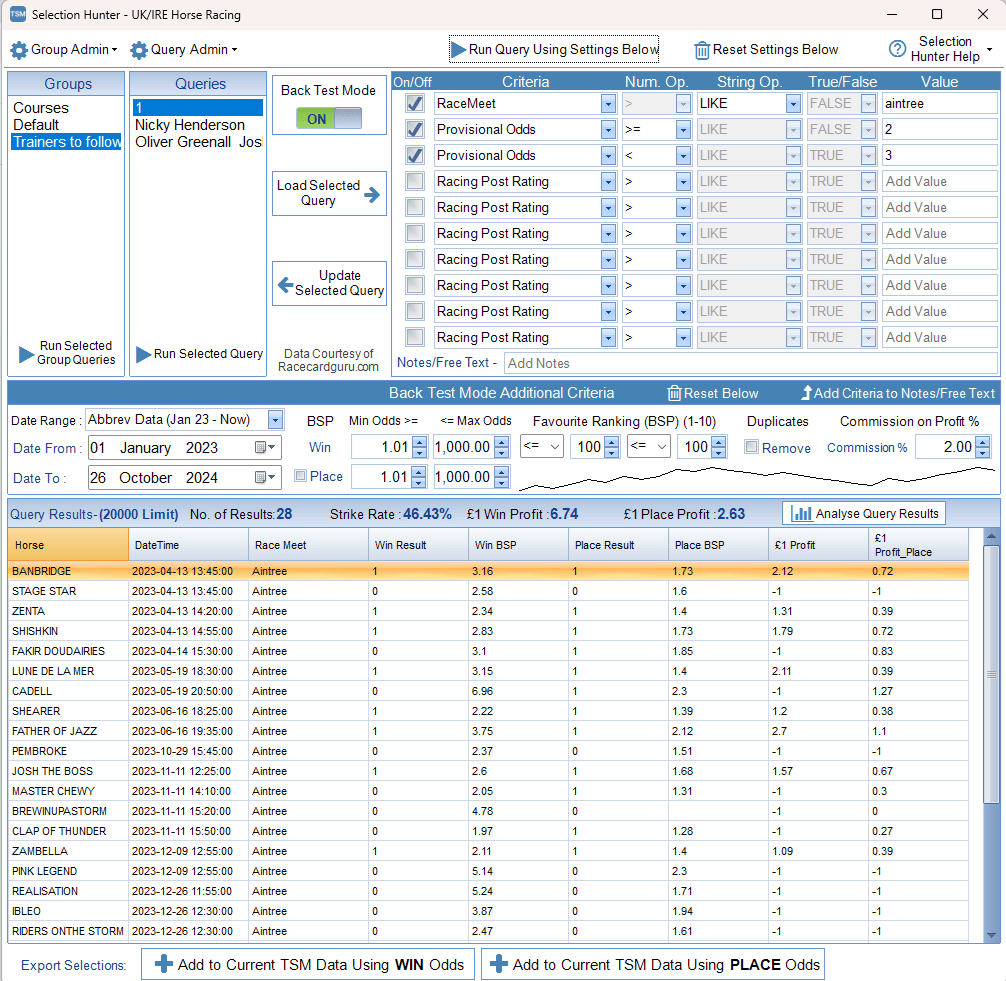
Make sure the Back Test Mode switch is set to on and the date range is Jan 23 – Now by selecting it from the date range drop down box and then Click the run query using settings below at the top of the interface.
This has produced 991 results which in effect is the number of horses that have run at Aintree since January 2023. We need to now analyse this queries results by clicking the box which is arrowed above. This will open the screen shown below

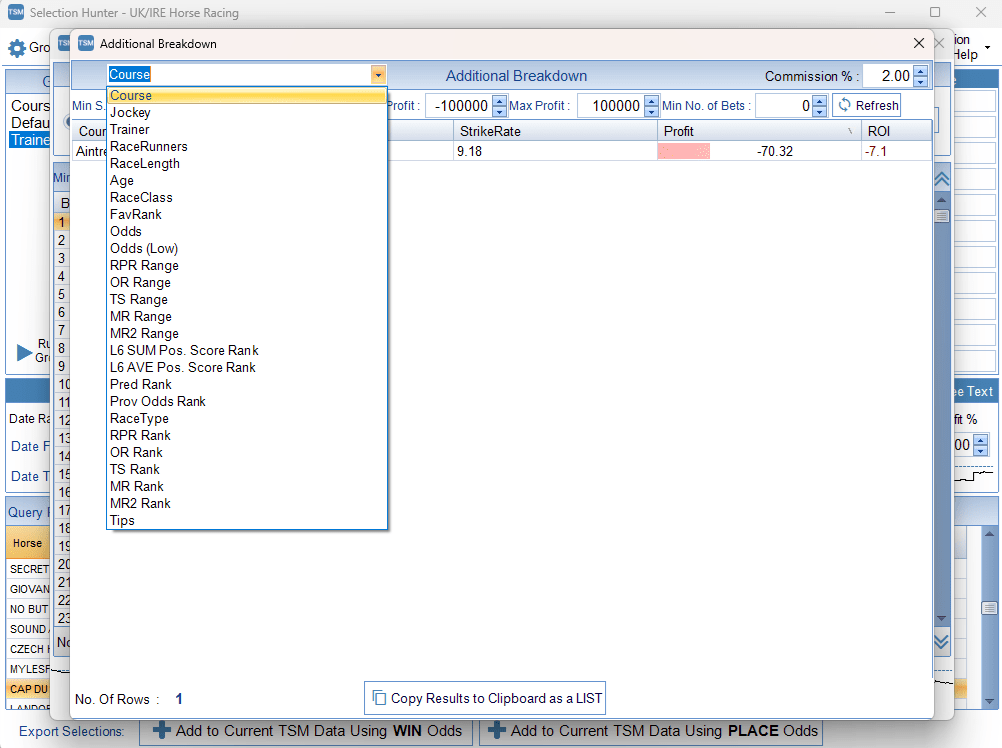
Next click the additional breakdown button arrowed to bring up the following screen.

We can now drill down our query to specific criteria such as Jockey, Trainer, Racerunners etc. For this demonstration I will select odds from this dropdown list to produce the following screen.

From this screen we can determine the optimum odds that produced the greatest strike rate and in this case with a strike rate of 68% odds of 2 to 2.99 BSP produced a return on Investment of 61.4% We can now enter these figures into the Selection Hunter interface as follows.

Under criteria and in the second dropdown box select “Provisional Odds” then in Num Op select >= then in the value box type 2 – this tells the query to look for horses that raced at Aintree in this period that had odds of 2.00 or more
In the next box down select provisional odds again but in the Num Op box select < and the value type 3 – this tells the query to look for horses that had provisional odds of less than 3
Make sure both tick boxes are filled nest to provisional odds and click the Run Query button again This will bring up the next screen shown below.

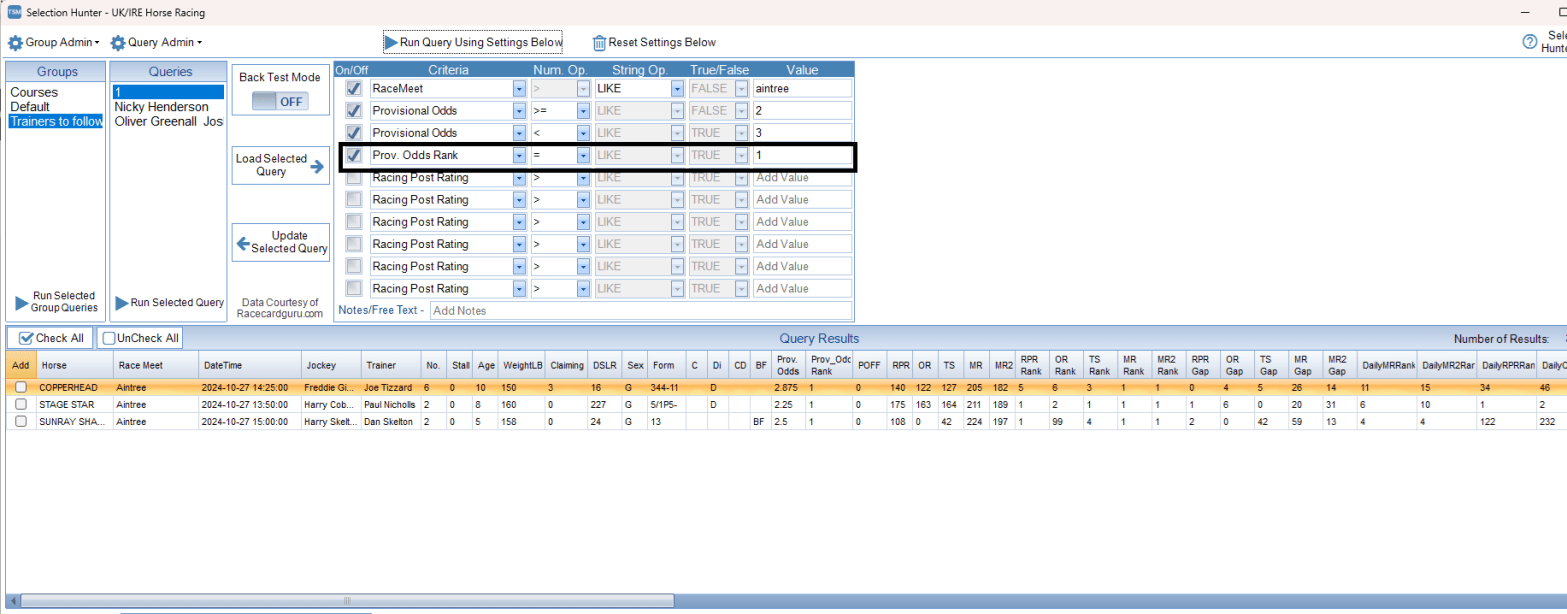
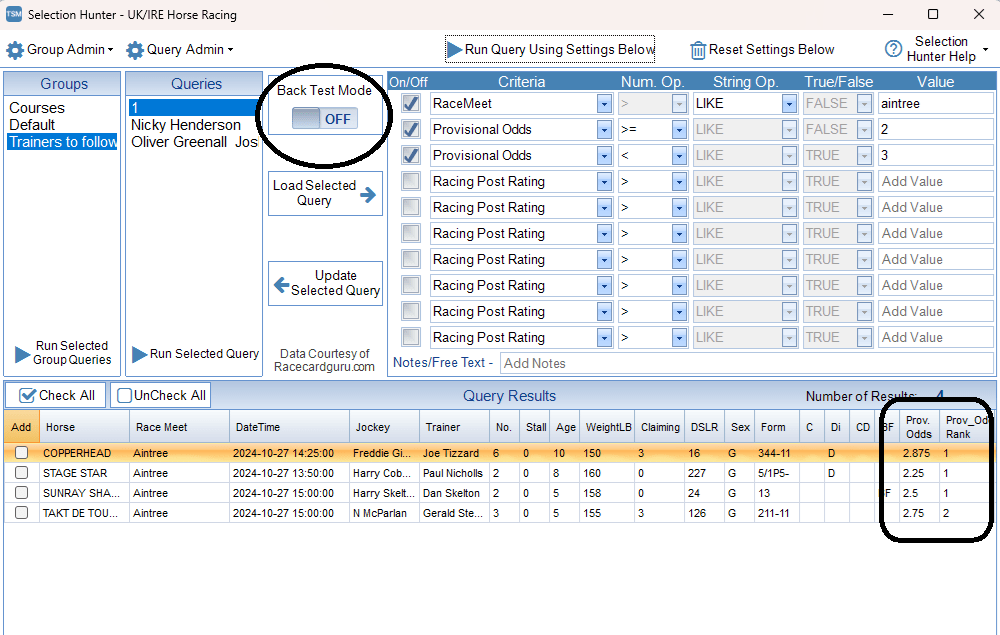
This is a very basic query which when run with the back test mode switched off will list all todays runners at Aintree that have a provisional starting price between 2.00 and 2.99 as shown below.

Thre are 4 runners today that meet this criteria and if you notice there are 2 selections for the 3 o clock – Sunray Shadow and Takt Des Touques. In the column next to Prov Odds you will see Prov Odds Rank and this is another factor that you can drill the criteria down by as shown below

In the screenshot above I have expanded the interface so this picture is not vey clear but if you click the image you will see a lot more information is readily available for each runner
So we have our short list of runners and with the strike rate of this query being 68% we can expect 2 of the 3 to win as long as the BSP is between 2.00 and 2.99
We can use Betangel to place or bets for us at the BSP range specified. ie 2.00 – 2.99

The selections are
13:50 Stage Star
14:25 Copperhead
15:00 Sunray Shadow.

The Staking Machine Software: Introducing Advanced Strategies – The Percentage Plan.

The “Percentage” staking plan is different to level stakes in the way you link the stake to your profit. With “The Staking Machine” software you can do some very clever things such as applying a different percentage to any profit and adding it to the base stake. In this post I will explore the myriad of settings to discover whether or not we can improve on the level stakes debarcle outlined in the main introductory post. If you have arrived here straight from google or some other entety other than the introduction post you can read it here

The first thing to do is to apply our desired settings to the relevant staking plan. To access this feature we click on the “Staking Plans” Tab at the top of the screen and then click the Edit Staking Plans Settings” button on the top left of the screen as shown below.

Accessing TSM staking plan settings.

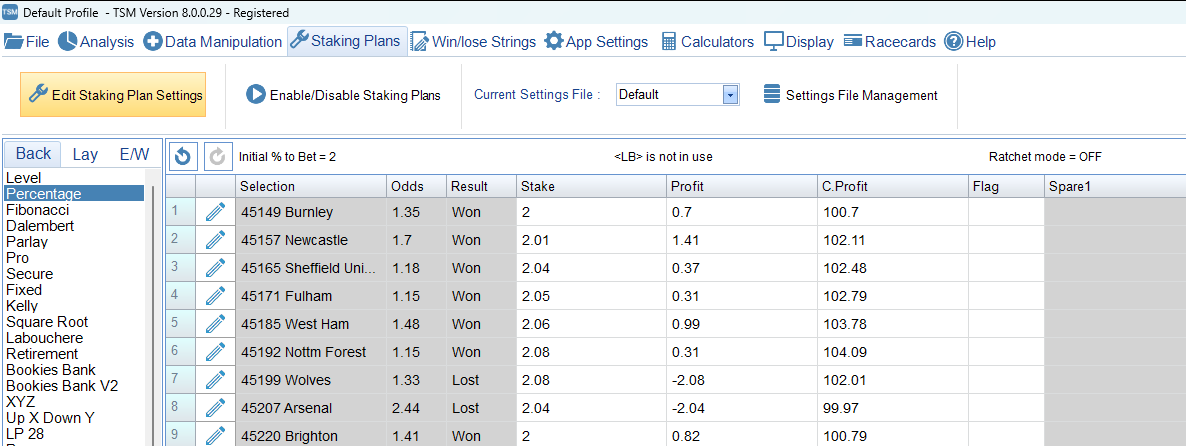
To begin with we should set our “bank” to the same as level stakes and the initial stake percentage the same. We are also going to set the minimum stake allowed to that of the initial start stake to make the staking machine calculate a stake that will never go below 2.00, this is done by ticking the box marked “Minimum Stake equals start stake” We are also going to tick the box “Re-calculate after x amount of bets” and enter 1 into the box. This will instruct TSM (The Staking Machine) to recalculate the stake after each bet. This can be seen more clearly in the screenshot of TSM below

Click the image to open in a new tab for a clearer view.

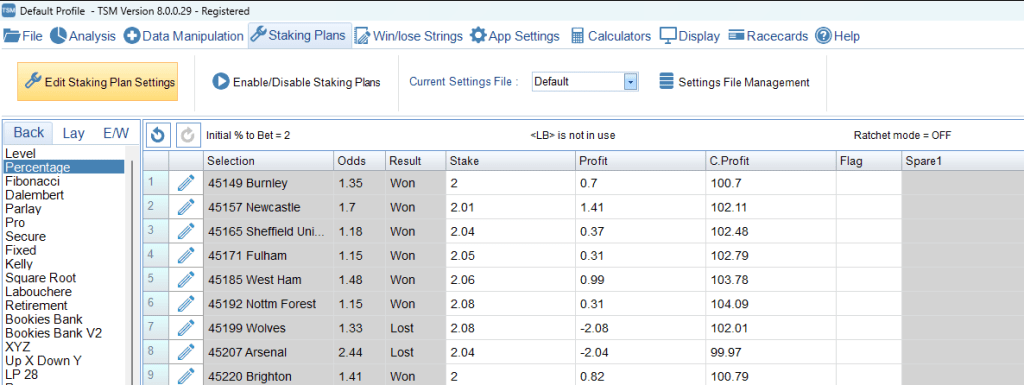
As you can see from the top image I have already loaded the data for last seasons Manchester Citys’ games and the software has calculated the stakes using the settings we have just entered, adusting the stakes for any profit or loss made. The same image is shown below and it clearly shows that when there was a profit made the stakes increased but when the cumulative profit became a loss the minimum stake rule kicked in and the minimum stake became £2.00. If we had left the “Minimum Stake Equals Start Stake” box unticked when Man City started losing you can see that the stakes reduced to 2% of our “Bank” – See bets 14 onwards shown below.

When the bank dips below its starting amount i.e. when you are no longer in profit TSM calculates the stake to 2% of the running bank if the minimum stake is unticked.

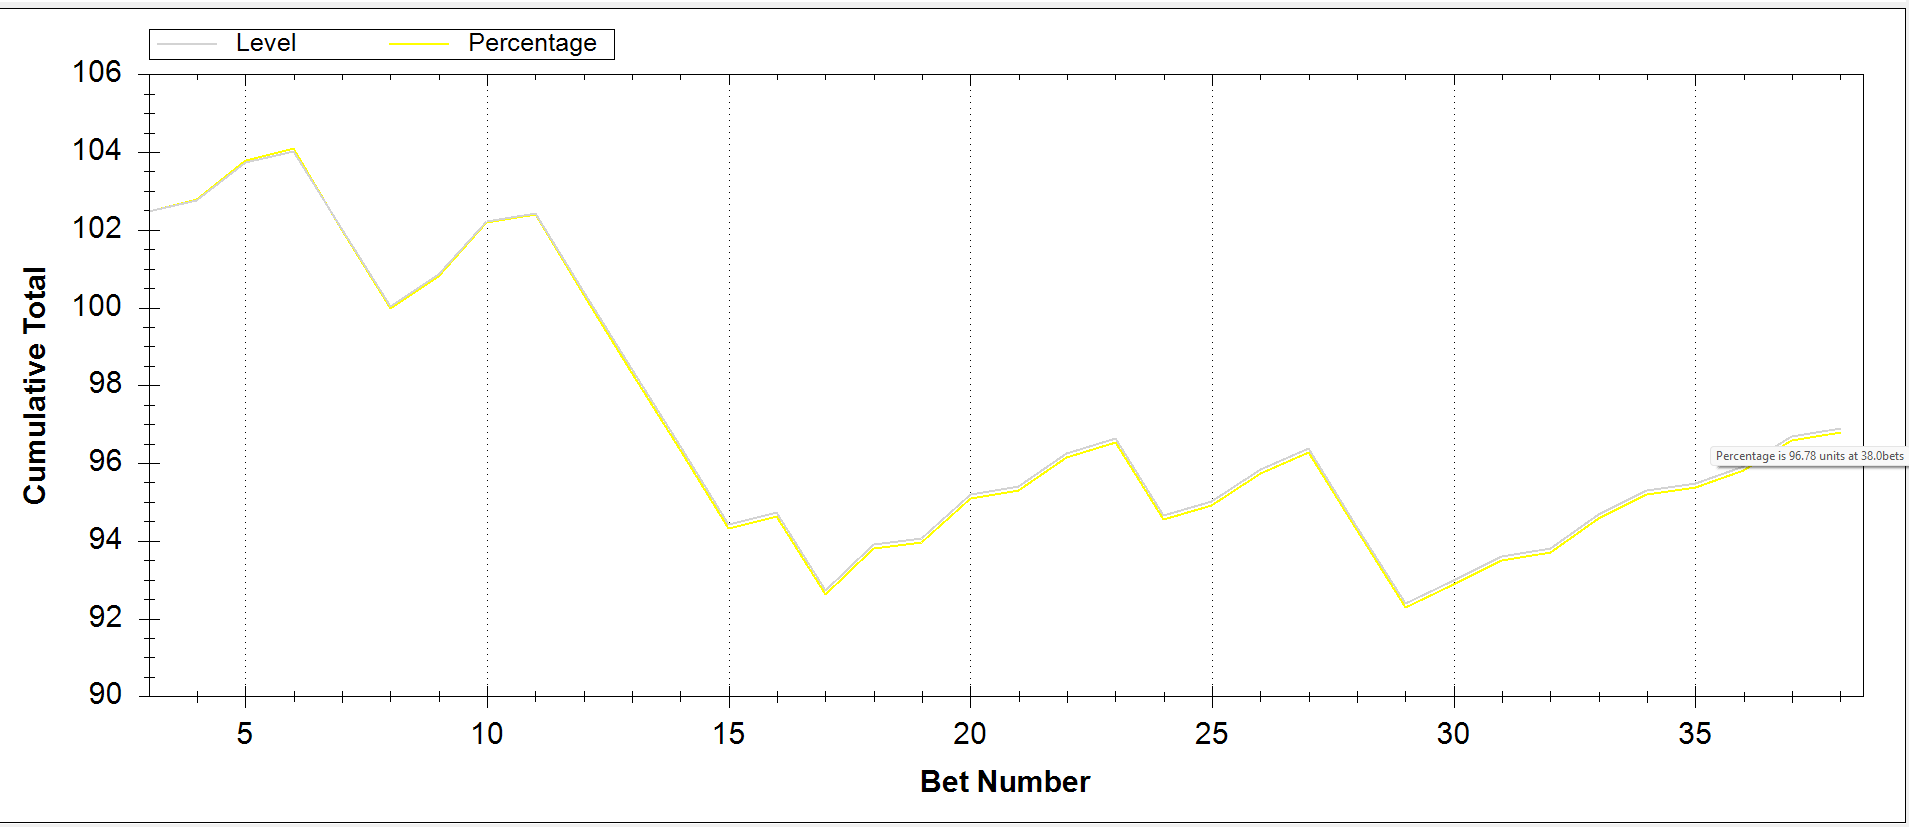
Because we are using the same data for level stakes as well as the percentage plan TSM can produce for us a graph that compares the two systems alonside each other. This is shown below.

A comparison of how the Percentage plan performed against level stakes using the initial settings determined above.

If you click the image above it will open in a new tab so that you can see from where i hovered my mouse above bet 38 on the percentage plan line that the plan ended with a further 10p loss compared with the level stakes plan. So on first impressions the percentage plan follows the level stakes plan very closely finishing with a very slight greater loss. There is however more setting that we can apply and one of these is to apply a different percentage to any profit and adding this to our base stake of £2.00 as the following shows. To turn this feature on we need to go back to our staking plan settings and tick the “Apply Different Percent % to Bet to any Profits” and enter the percent rate you would like to impement. I have entered 10%, this means that if we are £5 up it will add an additional 50p to the stake as shown below.

The following screenshot shows the increased stakes when this feature is implemented and the image immediately below that shows the normal percentage plan.

As you can see the percentage plan with the increased stakes the bank stands at £104.35 giving a profit of £4.35 where as the basic percentage plan the total is £104.09 or a £4.09 profit. When we start to lose however our increased stake means that on a losing bet the loss is greater. After Man City didn’t win the match against Wolves the basic plan shows a greater profit. If we get TSM to generate a new comparison graph using the new setting and compare it with level stakes the plans still follow similar paths but the percentage plan while rising above the level stakes plan at the end of the season it has under performed it by a further 40p loss.

Click image for a better view in a new tab

In quick summary for Manchester City it would seem that the percentage staking plan would not be suitable for bets involving very short odds even though the strike rate is quite high. What is becoming apparent is that if the strike rate is below the required strike rate determined by the average winning odds then you don’t stand much of a chance and it might be better to commit sacrilege and back your team to lose 😲. This we will explore later.

On to Tottenham and their creditable 5th place last season. As we saw in the introduction post Tottenham had a winning strike rate of 52.6% but their average winning odds of 1.81 dictated a required strike rate of 55.4% so even though the strike rate is still below the required strike rate can we recover losses with increased average odds or are we still doomed to failure and lining the bookies purse even more. The answer I am afraid is we lose even more than with the shorter odds.
The screenshot below (which is another great feature of TSM) shows the comparisons to a greater detail with totals such as highest peak profit and lowest trough loss

You will need to click the image to gain a better and clearer view of this screenshot – it will open in a new tab.

This feature is accessed by clicking the Analysis Comparison button on the main screen which will open in a new window the entire comparison stats for all the staking plans on the system – I have just shown the two that we are looking at so far.
If you click the image above it will open in a new tab so you can see more clearly the data it has produced
The first column shows the largest single stake used so you can get some idea of the stakes involved, With the level staking system the largest and smallests stakes are obviously going to show £2.00 as this is our level stake and that stands to reason. With the Percentage Staking plan with the settings described above the largest single stake was £3.39 and the smallest being £2.00 as we set our stake to be never below this figure or 2% of our starting bank which if you remember was £100.00. In the 5th Column it shows total stakes used and in this case the level staking plan used £76.00 as you would expect (38 games x £2.00). With the percentage plan our total stakes came out at £90.46 The most interesting column for us is the second to last which shows cumulative profit. This is our end of season figure and the Percentage plan under performs the level stakes by £2.80 with the cumulative profit being -£6.54. We can see this a lot clearer with the comparison graph below.

Performance of the Percentage staking plan against the level staking plan for Tottenham 23/24 season

As with the Manchester City analysis we can bring up a bar chart that identifies when Tottenham performed to the match odds this is shown below

This graph shows the number of matches that tottenham played where the win odds are grouped and the number of time they won in those ranges

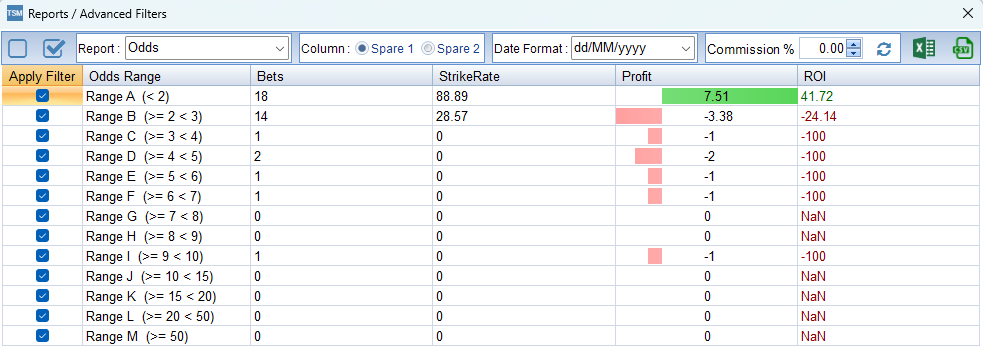
As you can see when the odds were below 1.5 Tottenham had a 100% strike rate. If we bring up the “Odds Report” we can see that the only grouping of odds where we would have made a profit was 2.0 and below.

Tottenhams strike rate when the match odds for them was below 2.0 was 88.89%

In summary then, using the percentage plan on matches that had win odds of 2.00 or below would have produced a profit of £7.51 over the season or a 41.07% Return on Investment.

We now move onto Crystal Palaces’ data and with £2.00 level stakes we would have profited by 11.48. If we remind ourselves Crystal Palaces winning strike rate was 34.2% for the 23/24 premiership season and they managed a creditable 10th place. Their average winning odds were 3.36 giving a required strike rate of 29.7%.
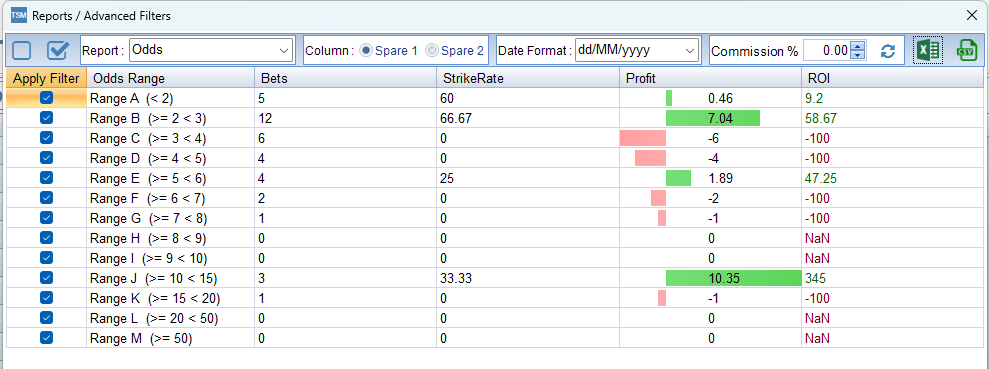
Using the Percentage Staking Plan with the settings unchanged from the two studies above our maximum single stake would have been £2.88 and again the lowest £2.00. There is another odds report that is available in TSM and the grouping of the odds is a lot more precise see below.

This report groups the odds into more precise bands.

Analysis of this kind can be invaluable as we can identify odds ranges that are more likely to provide a profit for instance if you look at the “Range F” row you will see that the odds range between 2.0 and 2.5 with a total of 10 games in that range with a 60% strike rate. If we tick the box in “Apply Filter” column and click the “Apply Chosen Filters” button at the bottom as shown in the screenshot below then it will populate the main TSM screen with just those results.

By filtering out other odds ranges we can analyse specific results.

By filtering out unwanted odds ranges we can make a more detailed analysis of specefic matches we would be better advised to bet on as shown below.

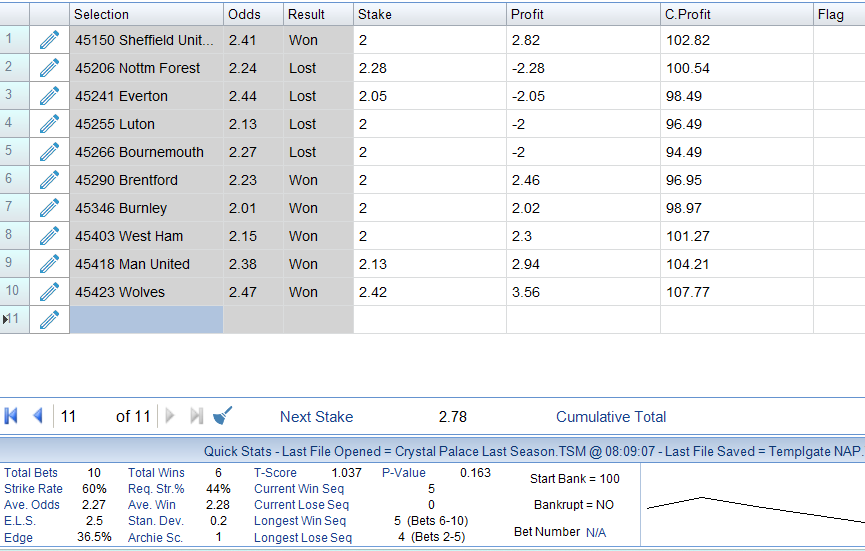
This screenshot shows just the matches where the match odds for Crystal Palace were just from match odds ranging from 2.0 to 2.5

We can see from the quick stats panel at the bottom of the screen that the strike rate is 60% and the average winning odds from the 6 matches that Crystal Palace won came out at 2.28 requiring a strike rate of 44% to enable us to make a profit. Only backing matches that fall into this sort of odds ranges can make for a dull season but the aim of this small section where i have diverted from the bigger picture is that with detailed analysis such as this and the pure ease that TSM enables this you can analise all the teams in the premiership in this way – or any other league for that matter to improve your profit potential by having separate files for each team and using a plan for each such team individually.

Any way back to the full season comparison between level stakes and percentage plan for Crystal Palaces’ 23/24 season.

Comparison graph for Crystal Palace between Percentage and Level stakes staking plans.

This is the familiar comparison graph showing the track from bet 1 to bet 38 and as we have come to expect they follow each other very closely. In this particular instance the Level Staking plan out performed the percentage plan by 10p over the season.

In summary, generally the level stake staking plan is ahead as far as the ROI factor is concerned but there are factors that you should be aware of. Staking plans can, if the right research is done, provide profit where there is the right correlation between the Ave win odds and strike rates.

Discovering Profitable Staking Plans for Premiership Teams

There are many “get rich quick” schemes flying around and to many staking plans are typical of these and to others the holy grail of betting. In this feature I am going to look at and back test just some of the miriad of plans that are available, some you may have heard of and some you most definitely haven’t.
As with any thing that is potentially damaging to your bank balance rigorous testing should be undertaken before risking your money with the bookies. In this series of posts I will be using the “Staking Machine” website software to analyse the results from a set study of Premiership teams taken from last seasons finishing positions of top (Man City) 5th Place (Tottenham) and 10th Place (Crystal Palace)

What are staking plans? Essentially staking plans are a tool where you can use a pre determined equation to set your stake for the next bet in a sequence that you have chosen beforehand you would like to bet on. This could be following a racing tipster in your favourite newspaper to betting on a set trap number in greyhound racing. This post will focus on football and backing your favourite team through the season.

So which staking plan would you choose? The list is quite extensive and I will be analysing all of the plans that are on the staking machines website but to name just a few there is level, percentage, 1326, Fibonacci, Parley and the list goes on.
There are some basic things that you would need to input into the software for some of the plans and one of them is that it needs the average winning odds. This means the average of the odds where the selection won.
There is a section on the main software screen that shows strike rates, average winning odds average odds losing sequences and winning sequences a snap shot of which is shown below.

This is the quick stats snapshot from the data |I have entered for Crystal Palaces’ 23/24 season. Click to view a larger version in a new tab.


With last years football results this is easy as all the data can be downloaded from http://www.football-data.co.uk, which provides downloadable raw data from most leagues from around the world but in so much detail as regards to the domestic leagues you need to slim the excel sheets down a bit. What I will be using is the spreadsheet available below and filtering out the home and away results of the teams mentioned above to glean the average winning odds.

Man City’s Home odds when they won at home

The screenshot above shows Man City’s home wins and the average home win odds provided by http://www.football-data.co.uk
The screenshot below shows the matches where Man City were playing away from home and the average odds for an away win.

Man City’s away odds when they won when playing away

As you can see I have used the power of excel to determine the average of the average home win odds when they won and the average of the away odds when they won away from home and these are – Average winning Home odds 1.21 and the average winning away odds are 1.39 giving an over all average winning odds last season of 1.21 + 1.39 = 2.6
2.6/ 2 = 1.30

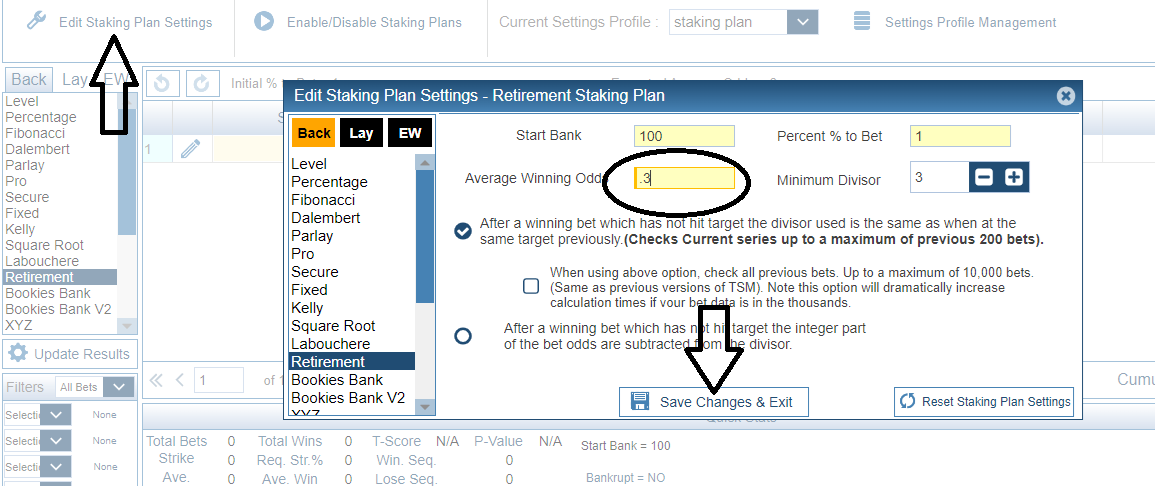
We can now enter this figure into the staking machine software. The rule for this is that you take the decimal odds of the average win odds and subtract 1 so the figure we enter into the winning odds box is 0.3

You can click the image above to open it in a new tab to make things clearer. Once this has been saved we can start entering the data from the spreadsheet. It should be noted at this point that the bank box is pre populated with £100 – you don’t physically need a £100 bank this is virtual all you need in your bookmaker account is the funds to make the next bet which is usually 1% of this i.e. £1.00. The demo mode of the software only allows you to input 10 results but I have subscribed so I can show you the full seasons bets.

Manchester city won 28 of their 38 league games last season (23/24) and subsequently finished league champions and everything that goes with this title but how did the devoted fan, who backs his team to win for £2.00 per week, fair? – Not too well to be honest. He would have lost £3.96 over the season. How can this be?

This graph shows the cumulative total using level stakes backing Manchester City to win throughout the season to a £1.00 level stake.


For a staking plan to work you need winners we all agree on that, but if the winners are at such a short price as Man City’s were then you need more winners. You may recall that the average “Winning Odds” for Man City last season was 1.3 this means that you would need a 76.8% strike rate to call a profit. Man City’s actual strike rate for last season was 73.7%. So Man City won the league and the bookies won the money- again!!!
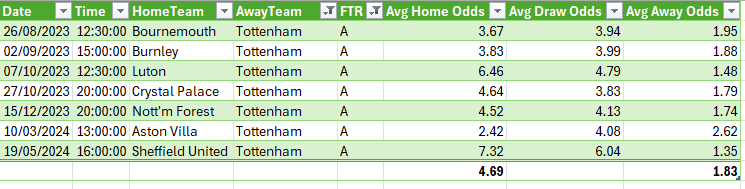
This is just one instance where the advocates of level stake betting won’t turn a profit even though the strike rate is over 70%. There are however staking plans that will net you a profit but they are not life changing. I will explore these in more detail as time goes on but for now I will outline what would have happened if you had backed Tottenham throughout the season to win.
So again we first determine the winning odds for Tottenham by finding the average home winning odds and adding them to the away winning odds and dividing by 2. We can easily do this by filtering the data in excel as we did for Man City.

The average home winning odds are 1.79

Tottenham won 13 of their home games producing an average of 1.79 winning odds.

When playing away their strike rate was very much reduced and their winning odds averaged 1.83
If we add these together and divide by 2 we get : 1.79 +1.83 = 3.62 / 2 = 1.81

Plagued by bad luck or just better teams Tottenham achieved a winning strike rate of just 52.6% where in weeks 11 – 15 saw their longest losing streak. Average winning odds of 1.8 require a winning strike rate of 55.5%. So Again the bookies win and the fans wonder why when their team did so well in coming 5th in the table have, to a level stake of £2.00 on each game £5.00 less than when they started.

This graph shows the frequency of the odds grouped into values and how many matches they won at those ranged odds.

As you can see from the graph above when the odds were below 1.5 (7 in total) Tottenham won all of their games – as the odds suggest that they should have. the plan all starts to go pear shaped when the odds rise above 2.0 and more research might reveal that not backing Tottenham at these odds could improve the profit figure. The table below shows the ranges of odds and the profit/loss and a return on investment (ROI) had you just backed tottenham within these ranges. It should be noted that these figures are to a £1.00 level stake not £2.00

Click on the image to open in a new tab for a clearer look.

Finally on this post the results from 10th placed Crystal Palace. Crystal Palace had a total of 13 wins out of their 38 league matches giving a strike rate of 34.2%. Their average winning odds for these 13 games was 3.36 which required a strike rate of just 29.7% for all games over the season. This team would have made their fans a profit of £8.39 over the season if they had backed them to win with a level stake profit of £2.00

The following graphs and tables show in more detail the figures quoted above for Crystal Palace and the 23/24 season

Backing matches at “Bread and Butter” odds (1.5 – 3.0) would have shown a profit and 2 wins, one at odds between 5.5 and 6.0 and another at odds of above 10.0 and this can be better seen in the table below Again these figures show profit/loss to a £1.00 level stake.

Click to veiw in a new tab.


These are back tested results and show what would have happened if you had backed your team to level stakes and while not entirely picked at random for this study it does show that care needs to be taken when blindly backing at level stakes. Manchester city might have won nearly 3/4 of there league games but it was not enough to turn a profit
In the posts that follow I will be analysing the same 3 teams using a variety of staking plans to determine if there was a greater profit or a reduced loss to be made and still keep the betting enjoyable.

There is one more point I would like to make on the subject of strike rates and winning odds averages. The bookies know that if they are offering odds that are below the average winning odds then they are going to win. If you know about odds movement when a match is in play then you will realise that there are many times that you can back a team in play when the win odds of the team will rise above the average winning odds giving you the edge instead of them – There is of course the distinct possiblity that they may score early in the game!! These are all things that have to be considered and a risk assessment taken. Don’t be in such a hurry to lose your money!

The staking plans I will be using will be taken in the order listed on the staking machines software and after Level stakes the next plan is called “Percentage”. Below is a list of all the staking plans used which, when I have written the post will have a link attached so you can easily go straight to the post. Some of the plans I have never heard of and further reading on his site reveals that he himself has invented them.

Percentage
Fibonacci
Dalembert
Parlay
Pro
Secure
Fixed
Kelly
Square Root
Labouchere
Retirement
Bookies Bank
Bookies Bank v2
XYZ
Up X Down Y
LP 28
Recovery
Recovery Type 2
Recovery Type 3
SAW
Rolling Doubles
Coup Master
1 Point
i-TSM Plan