Further to my post on Bookies and Tipsters I will be following Hugh Taylors Tips and Backing each one for a £5.00 Profit with SkyBet. Not at the advised odds but at whatever odds are available at the time but because Skybet like to pay out on extra places and offer few races with Best Odds Guaranteed I will be backing them at SP with a stake that will give a £5.00 profit at the odds given at the time.
Four selections today and going into the 5th day with a profit of £3.78 First selection to run today is
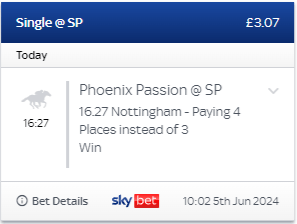
4:27 Nottingham : Phoenix Passion Advised Odds 5/2 (3.5) Odds available at 10:00 : 13/8 (2.63) Stake £3.07 Result –
Second to run is
5:35 Kempton : Remaat Advised Odds 11/1 (12.0) Odds available at 10:00 : 3/1 (4.0) Stake £1.67 Result –
Odds of 3/1 taken as SkyBet are offering Best Odds Guaranteed
The third Selection was City House in 7:15 at Kempton but has been withdrawn and is a non-runner.
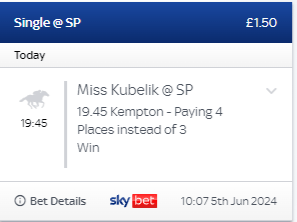
Fourth and Final Selection today is 7:45 Kempton : Miss Kubelik Advised Odds 9/2 (5.5) Odds available at 10.00 10/3 (4.33) Stake £1.50 Result –
Good Luck all – need it – these bets take me into a Loss state 😂
Yesterday I backed Hugh Taylors sole selection at S.P. Here’s what happened (If you have just happened upon this post and are thinking why would I back a horse at SP when the price is steaming in please read the post I did on researching his April Selections the link is immediately below and will open in a new tab)
Further to my post on Bookies and Tipsters I will be following Hugh Taylors Tips and Backing each one for a £5.00 Profit with SkyBet. Not at the advised odds but at whatever odds are available at the time but because Skybet like to pay out on extra places and offer few races with Best Odds Guaranteed I will be backing them at SP with a stake that will give a £5.00 profit at the odds given at the time.
Only one selection today and is as Follows
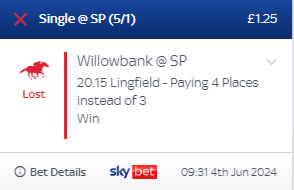
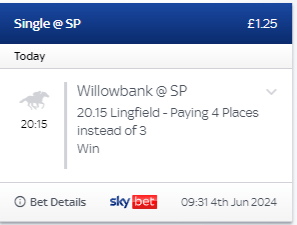
Lingfield 8:15 Advised Odds 9/1 (10.0) Odds available at 09:30 : 4/1 (5.0) Stake 1.25 Result –
Yesterday I backed Hugh Taylors 3 selections at S.P. Here’s what happened (If you have just happened upon this post and are thinking why would I back a horse at SP when the price is steaming in please read the post I did on researching his April Selections the link is immediately below and will open in a new tab)
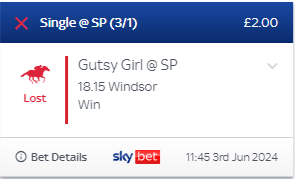
First to run was Gutsy Girl which was advised at odds of 4/1 (5.0) I backed it at 11:45 at S.P but the odds available then was 5/2 (3.5) Unfortunately it could only manage 3rd place.
Gutsy Girl (3rd)
Profit is Plummeting and the next to run was Valkyrian in the 8:45 at Windsor Advised at Publication at 16/1 (17.0) Stake was 67p at S.P. as available odds had halved to 15/2 (8.5) S.P. Odds recovered to 12/1 (13.0) which would have been nice if it had won instead of coming 7th
Valkyrian (7th)
With another 67p knocked off the profit the last runner on Hughs list was Coin Power. Advised at odds of 10/1 (11.0) by the time I got my 91p on at 11:45 the odds had dropped to 11/2 (6.5) By Post time the S.P. was 7/1 so again disappointing not to have surpassed advised odds but had it of won instead of coming 8th then I would have a profit of £6.37 instead of my target fiver.
Coin Power (8th)
Numerous people have now pointed out to me that S.P. is a poor bet and I agree but in all of the runners so far this month all have been above the odds available at the time the bet was struck so that with any other bookie than SkyBet Best Odds Guaranteed would have been applicable and instead of backing at S.P. I would have taken the offered odds for my Guaranteed fiver if it won. The sole purpose of this study if you like is to try and make people see that, yes the bookies decimate the odds to capitalize on the faithful which to my mind is despicable, but the odds can and do recover sometimes to a mark greater than the advised price at publication time. Its a good job Hugh had a couple of winners Saturday because my Profit is now down to £5.03
Today I backed Hugh Taylors sole selection at S.P. (If you have just happened upon this post and are thinking why would I back a horse at SP when the price is steaming in please read the post I did on researching his April Selections the link is immediately below and will open in a new tab)
Todays Selection was Cargin Bhui which ran at Hamilton this evening. Advised odds were 11/4 but just 1 hour later those odds had been cut to 2/1 Working to a profit of £5.00 per winner I staked £2.50 to Win at S.P. in the hope that the odds drifted towards post time A very close 2nd place has reduced my June Profit to £8.61
S.P. as you can see was 3/1 Another selection where S.P. was greater than the advised odds 👍
Further to my post on Bookies and Tipsters I will be following Hugh Taylors Tips and Backing each one for a £5.00 Profit with SkyBet. Not at the advised odds but at whatever odds are available at the time but because Skybet like to pay out on extra places and offer few races with Best Odds Guaranteed I will be backing them at SP with a stake that will give a £5.00 profit at the odds given at the time.
Only one selection today and is as Follows
6:10 Hamilton Cargin Bhui Advised Odds 11/4 (3.75) Odds available at 10:30 : 2/1 (3.0) Stake 2.50 Result –
Yesterday I backed all four of Hugh Taylors ATR racing tips but instead of clamoring to get my money on before the odds disappeared I simply backed them at S.P. (If you have just happened upon this post and are thinking why would I back a horse at SP when the price is steaming in please read the post I did on researching his April Selections the link is immediately below and will open in a new tab)
First in the List was Sea of Thieves in the 2:00 at Epsom Downs at an advised price at publication of 14/1. This was published at 9:11 and by 10:30 the odds were 9/1. I backed this at S.P. for 56p which would have given me £5.00 profit if the odds stayed at 9/1 or a bonus amount if the odds drifted and by some miracle the horse won.
As you can see from the settled bet that the price did drift, not to the advised price but close and if it had won would have given a profit of £6.72 instead of the £5.00 at the 9/1 price.
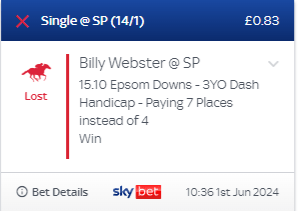
Second to run was Billy Webster in the 3:10 again at Epsom. Published at 9:24 at advised odds of 10/1. I again backed this at S.P. for a stake of 83p as the odds available at 10:30 were down to 6/1
The calculation for these bets is simple Target profit / Decimal odds -1 £5.00 / (7.00 – 1)
By Post Time the odds had drifted to 14/1 which would have given a profit of £11.62 if it had won.
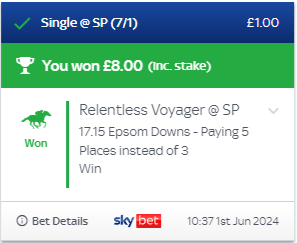
Taylors next selection to run was also at Epsom and he tipped Relentless Voyager in the 5:15 at an advised price of 13/2 (7.5) at the publication time of 9:03. By 10:30 these odds had sunk to 4/1 or 5.0 in decimal. Backed at S.P. for a stake of £1.00 to reap a £5.00 profit if the odds didn’t sink further.
As you can see the odds drifted out to 7/1 (8.0) at post time and the horse won giving a profit of £7.00 instead of the £5.00 target figure.
Taylors fourth and final runner was at Doncaster in the 6:15 and was published on the ATR website at 09:39. Wild Waves price was advised at 9/2 (5.50) at this time and an hour later was a mere 5/2 (3.50) on Sky Bet. Backed at S.P. for a £2.00 stake my target profit if the odds didn’t dip below this price and if the horse won would again be £5.00
As you can see from my settled bet slip This horse also won at 11/4 (3.75) and while the odds didn’t reach those of the advised price by a long chalk they did drift slightly from the 3.50 giving me a profit of £5.50
My Total profit from these four bets ended up at £11.11 from a total of £4.39 staked! Better than being poked in the eye with a sharp stick I think.
I know that if I had used another bookmaker that offered BOG then I would have had guaranteed odds and could have taken the price offered without fear of the odds dipping some more. As it is if I had taken the prices offered by SkyBet at the time of striking the bets then my profit would have been £8.61 – £2.50 less than my actual profit. If you had used the same staking method AND had been able to get the ADVISED prices then the profit would have been as follows
Sea of Thieves Advised odds 15.00 Stake 36p Lost P/L -36p Billy Webster Advised odds 11.00 Stake 50p Lost P/L -50p Relentless Voyager Advised odds 7.5 Stake 77p Won P/L £5.01 Wild Waves Advised odds 5.5 stake £1.11 Won P/L 4.99
Further to my post on Bookies and Tipsters I will be following Hugh Taylors Tips and Backing each one for a £5.00 Profit with SkyBet. Not at the advised odds but at whatever odds are available at the time but because Skybet like to pay out on extra places and offer few races with Best Odds Guaranteed I will be backing them at SP with a stake that will give a £5.00 profit at the odds given at the time.
Todays Selections are as follows
2.00 Epsom Downs : Sea of Thieves Advised Odds 14/1 Odds available at 10:30 : 9/1 Stake 56p Result –
3.10 Epsom Downs : Billy Webster Advised Odds 10/1 Odds available at 10:30 6/1 Stake 83p Result –
5.15 Epsom Downs : Relentless Voyager Advised Odds 13/2 Odds available at 10:30 4/1 Stake £1.25 Result
6.15 Doncaster : Wild Waves Advised Odds 9/2 Odds available at 10:30 5/2 Stake £2.00 Result –
I recently watched a youtube video by Caan Berry, who, quite accurately, put forward a case for not backing online tipsters as the odds very quickly diminished as soon as or even before the tip was published online. Conspiracy theorists would have you believe that there may be some collusion between tipsters and bookies that would enable bookies to make a bigger margin on the tips that lose and perhaps cutting the online platform that published them a bigger affiliate payout. There is no doubt that odds do disappear very quickly but in the bigger picture of racing as a whole to keep the odds low on a horse just because a tipster tipped that horse could prove very expensive for bookies if another horse with better ability and was being backed towards the start of the race stayed at the bigger odds and went on to win. Bookies are scaredy cats, money going onto other horses will lower their odds, its a fact! It is true that if a tipster has a big and loyal following then those punters will undoubtably blind bet on the selection for fear of the odds dropping even more, this is bonanza time for the bookies. They take pots of cash at crap odds on a horse trying not to split their sides laughing at all the punters doing their bank blindly. What is a little more concerning is that on some bookies sites “Best Odds Guaranteed” doesn’t kick in until an hour or more after the tip is published so they don’t have to payout at the bigger price if the odds drift. That’s the conspiracy part over now I will look at some facts and as Caan Berry singled out Hugh Taylor of At The Races Website I will look at his results from April 2024 (His latest complete results available).
In April Hugh Taylor had 65 tips in total claiming a 30.09 point profit for the month at advised odds and stakes. Of these 65 tips 3 were E/W tips and for the purposes of this post I am going to discount them as I personally rarely back E/W bets. Many of you reading this may disagree, this is your choice and you could apply the same staking method that I will outline in this post to all of his tips, that is your own personal possible course of action. The purpose of this post is not to condemn any one party whether it is Taylor himself the website for misleading information or the bookies for offering criminal odds, it is to analyze the timings of the tips published and the reaction of the markets to these tips and most importantly what the actual SP of the tip was at the off. To make this a fair study I am going to stake each tip with a profit if wins of £5.00 on the advised odds, Industry SP and the Betfair exchange SP. I know that the minimum bet on the exchange is now £1.00 and the stakes you will see on many of these selections is way lower than that but these lower stakes are possible if you use software that allows this such as bet angel ( I will put a link to this at the bottom of the post)
To achieve a level profit target figure the calculation is simple.
Stake = Target / (Odds-1)
If we look at Taylors first tip of the month which was Twilight Madness in the 16:05 at Kempton on 1st April he advised odds of 12.0 (11/1) so the stake for this bet would be
Stake = 5 /(12-1) = 45p Unfortunately I have no way of knowing how far the odds dropped just after tip publication but the horse did go off at the same odds and on the exchange the BSP was 15.67. Figures courtesy of Timeform who publishes these figures for reference purposes) The horse lost of course (Last actually) so our losses would have been Tip publication Time (If actually available) -45p Bookmakers SP -45p Betfair exchange SP -34p. As you can see we would be better off by 11p if we had used the excchange to place our bet. The following excel sheet lists all of Hugh Taylors tips for April except for the E/W bets.
Of the 62 remaining tips after discounting the E/W bets you can see that a total of 15 won and using the staking method outlined above the profit to the advised odds of just £6.01. If we had backed the same horses at the industry S.P. you can see that we would have won nearly twice as much and better yet before commission is taken from the exchange bets three times as much. So, there is a case for backing Taylors tips. He has a strike rate of about 25% but the profits are not breathtaking.
Conclusion. Hugh Taylors tips are for free, there is no subscription to pay, and if you keep your stakes to a manageable level there is no reason why you shouldnt have a couple of bets each day. There is however another option – we can lay these tips and then back them just before post time!
We know that the bookies lower the odds just after publication and that perhaps the more savvy amongst us back them on the exchange to get a closer price to advised odds than backing them at the bookmaker. This acts to cause the exchange market to react in the same way as the bookies price lowering and the exchange market starts to reflect the industry prices more closely. If you look at the spreadsheet above you will notice that in most of the tips the exchange S.P. is quite a few ticks higher than even the advised price earlier in the day. This means that there is a possibility of a viable lay to back trade opportunity here.
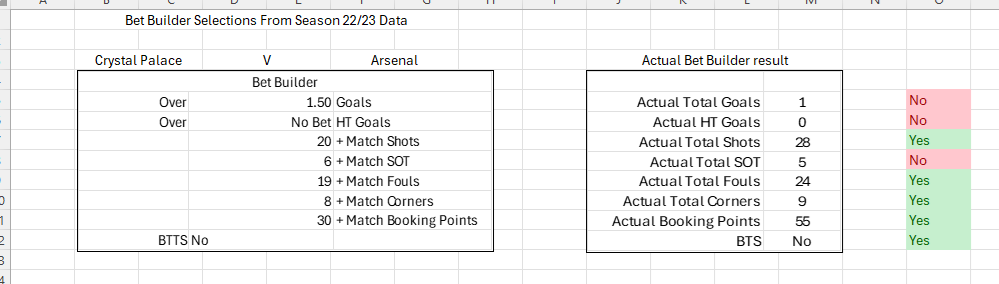
Requesting your own “build a bet” is not as daunting as first supposed they can only say no or more probably not reply at all but in the cases where they do price your bet they sometimes feature it on the platform. Firstly you need to be armed with your own figures and an idea of what sort of markets you are going to put in to it. To this end I have the beginnings of a Workbook for the premiership which will list the following probable outcomes based on the seasons figures for each team involved. Full Time Goals Half Time Goals Match Shots Match Shots on Target Match Fouls Match Corners Booking Points BTTS
The following is a screen Shot of the stats and actual results from the 2nd game of the season Arsenal v Notts Forest
Arsenal v Notts Forest Sat 12 Aug 2023
The data on the left is collated from all the games Arsenal played at home in the premiership in the season 22/23 and all the games Notts Forest played away in the season The figures on the right are the actual stats from the game played. As you can see the predictions were right on all counts save total shots and the BTTS predictions.
The following games were played that first league week Burnley v Manchester City – No Data
Arsenal v Nott’m Forest – As Above
Bournemouth v West Ham
Bournemouth v West Ham Sat 12 Aug 23
Brighton v Luton – No Data
Sheffield Utd v Crystal Palace – No Data
Newcastle v Aston Villa
Newcastle Utd v Aston Villa Sat 12 Aug 23
Brentford V Tottenham
Brentford v Tottenham Sun 13 Aug 23
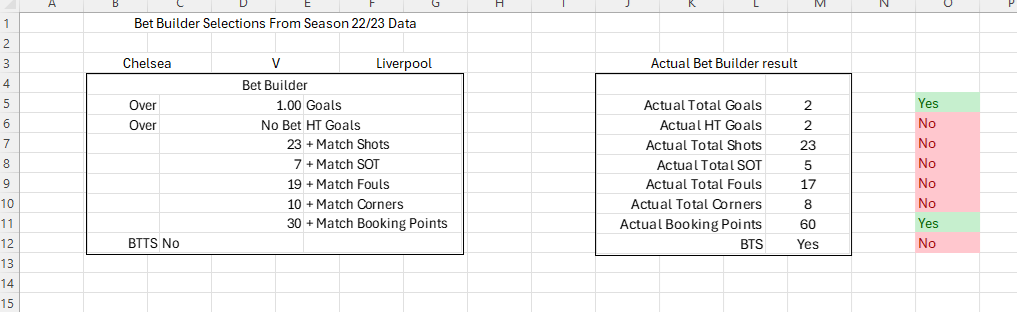
Chelsea v Liverpool
Chelsea v Liverpool Sun 13 Aug 23
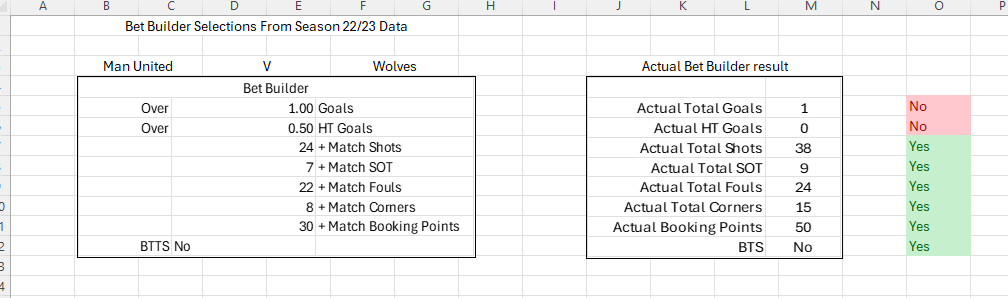
Man Utd v Wolves
Man Utd v Wolves Mon 14 Aug 23
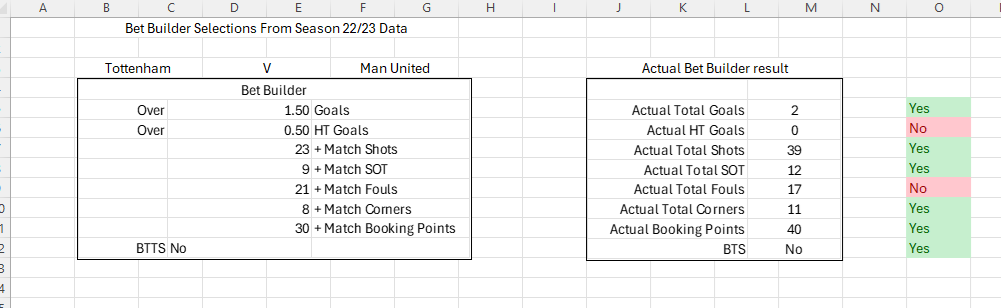
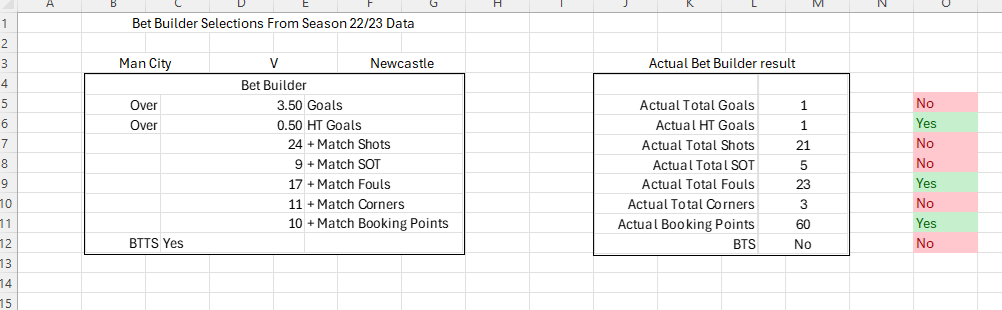
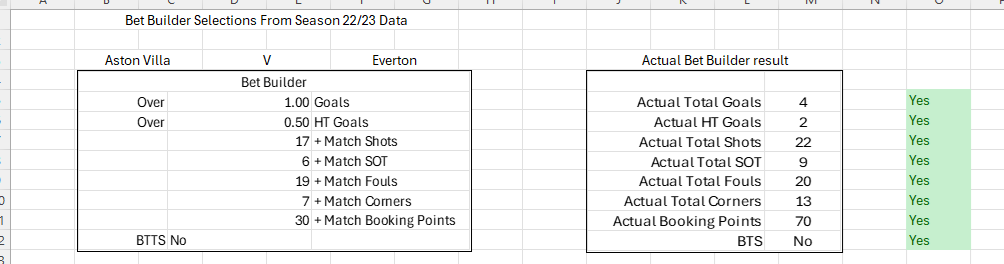
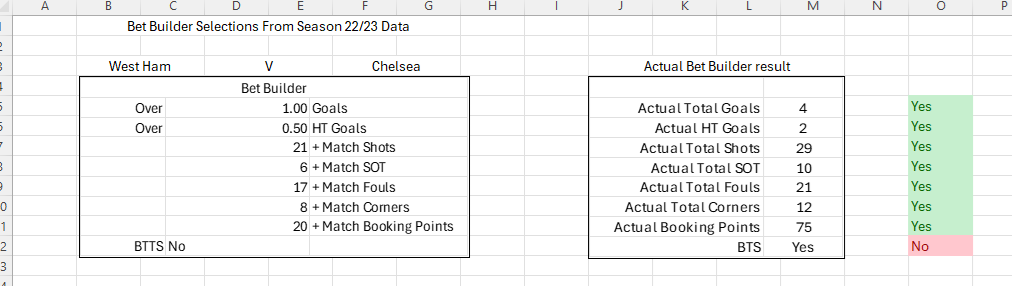
As you can see from the above screenshots there was just one match which was a winner with all selections coming in.
Nott’m Forest v Sheffield Utd – No Data
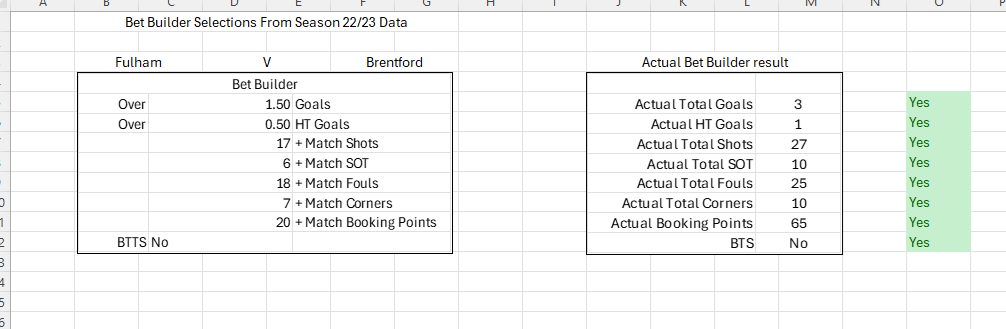
Fulham v Brentford – 0-3
Fulham v Brentford Sat 19 Aug 23
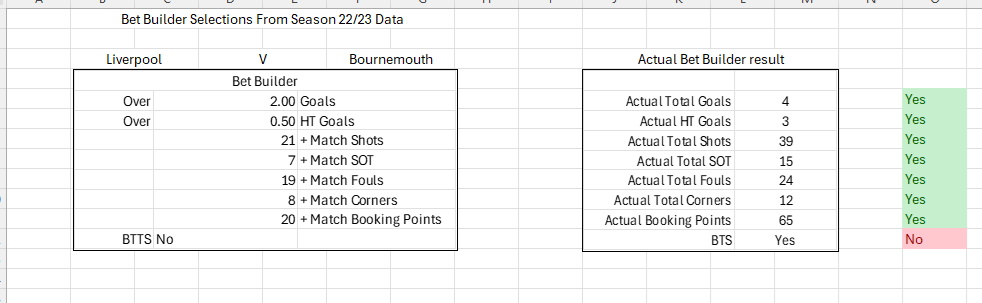
Liverpool v Bournemouth – 3-1
Liverpool v Bournemouth Sat 19 Aug 23
Wolves v Brighton – 1-4 Note – The actual corners leg won as the prediction was 8+ ie 8 or more but the bet still lost on the BTTS leg ( I will explain the intricates of the bets below as some bookmakers interpret the wording of bets differently to others)
Wolves v Brighton Sat 19 Aug 23
Tottenham v Man Utd – 2-0
Tottenham v Man Utd Sat 19 Aug 23
Man City v Newcastle Utd – 1-0
Man City v Newcastle Utd Sat 19 Aug 23
Aston Villa v Everton – 4-0
Aston Villa v Everton Sun 20 Aug 23
West Ham v Chelsea – 3-1
West Ham v Chelsea Su 20 Aug 23
Crystal Palace v Arsenal – 0-1
Crystal Palace v Arsenal Mon 21 Aug 23
Luton Town v Burnley – No Data This match was postponed until 3rd Oct 23
Week 2 saw two of our bet builder bets winning but we are regularly being let down by the BTTS selection but I am getting a degree of success with this workbook when I back test Week 3 saw another two builda bets coming in Bournemouth v Tottenham and Newcastle v Liverpool with 2 more being let down by the BTTS leg.
What odds can you expect to get with these bets? That depends on the bookmakers who are willing to price these bets up! You can request these bets via the twitter (or X as it is now known) by using the individual betting sites hash tag address and I found that if you sent your request to them with all of the bookies hash tags in the message then whether or not they thought they might be in competition with each other the odds tended to come back slightly better. The following was one such bet I requested for the Leicester City v West Brom game on 20th April
Typical request a bet post
I got a quick response from Coral with favourable odds of 7/1 (8.0) I also got a message from SkyBet saying that I could build this bet on there platform but this was not strictly true as they didn’t offer some of the legs that I requested. But it is always wise to shop around.
This bet lost 🙄 on the corners leg as I requested a price on the Over 10.5 instead of 10+ market If I had worded this as “10+ Corners” it would have won!!! as there was exactly 10 corners in the match
Lastly I will provide this work in Progess worksheet for you to backtest the entire season if you wish however the 3 promoted sides last season – Burnley, Luton and Sheffield Utd will have no data for the 22/23 season